
2019-20 Departmental Results Report
View the print-friendly version: (PDF -1.35MB)
ISSN 2561-0996
Table of contents
Minister’s message
It is my pleasure to present the 2019-20 Departmental Results Report for Western Economic Diversification Canada (WD). As the department continues to support entrepreneurs, industry and the research community to confront the COVID-19 pandemic, the various organizations in the ISED Portfolio have coordinated their efforts to position Canada as a global innovation leader and shape an inclusive economy for all Canadians.
In 2019-20, WD continued to build strong communities across Western Canada, including in rural areas through implementing well thought-out measures to advance the West’s dynamic and diverse economy. The department made progress by strategically supporting key local businesses and larger industries, influential institutions and organizations, and critical supply chains and exporters. WD has made a difference. The results are reflected in the number of firms that are innovative and growing in Western Canada, the range of economically diversified communities, and the scale of business investment to develop and commercialize innovative technologies.
In addition, WD continued to collaborate with federal and provincial partners to promote economic diversification, trade, skills and community development under the Western Canada Growth Strategy.
These are just a few examples of Western Economic Diversification Canada's work on behalf of Canadians regardless of their background, region or generation. I invite you to read this report to learn more about how we are promoting the development of western Canada’s economy.

The Honourable Mélanie Joly
Minister of Economic Development and Official Languages
Deputy Minister’s message
Westerners are accustomed to dealing with changing – and often challenging – economic circumstances. The period covered by this report includes the early stages of the COVID-19 pandemic, when the scope of its impacts on western Canadian families, businesses and communities was just beginning to be known.
Since then, our primary focus has been to support businesses so that the families that rely on them can have security of employment and hope for the future. I am proud of how our small team stood up with passion to meet that challenge. We also relied on many partner organizations who excelled during this period and to whom I am thankful.
As Westerners know, good times will come again. Thanks to our efforts and their own ingenuity, many Western firms will be ready to grow again when that time comes. Their success – and what it means for all Westerners – is the result that matters to us.

Dylan Jones
Deputy Minister
Western Economic Diversification Canada
Results at a glance and operating context
| What funds were used? (2019–20 Actual Spending) |
Who was involved? (2019-20 Actual Full-Time Equivalents [FTEs]) |
|---|---|
| 309,080,429 | 334 |
For over 30 years, Western Economic Diversification Canada (WD) has been working to diversify the western economy while improving the quality of life of western Canadians. WD is a leader in building a strong, competitive western Canada by focusing on business development, innovation, and community development. In 2019-20, WD undertook the following activities and achieved key results:
- WD’s efforts focused on job creation and business growth throughout western Canada, namely:
- WD-assisted innovation and business growth projects reported the creation of 4,306 jobs, including jobs for 2,677 highly qualified personnel (HQP), in support of the department’s cluster growth priority and the Government of Canada’s Innovation and Skills Plan.i
- Additionally, the Community Futures Program created, maintained, or expanded a total of 5,836 jobs through investment loans to western Canadian businesses located in rural and remote communities.
- Western Canadian firms that borrowed funds through the WD-funded Community Futures (CF) Program increased their sales by 7.68 percent and grew their employment by 2.49 percent annually. This is much higher than non-CF clients whose sales increased by 6.82 percent and whose employment grew by 0.82 percent annually from 2012 to 2017.ii
-
WD programming aimed to promote inclusive economic growth in western Canada.
- The Women’s Enterprise Initiative created, maintained, or expanded a total of 1,288 jobs through investment loans to western Canadian businesses.
- The department invested $35.7 million in 149 women-led projects and $13.1 million in 23 Indigenous economic growth projects.
- In support of the department’s cluster growth priority and the Government of Canada’s Innovation and Skills Plan, WD invested $26.8 million in 23 clean technology projects.
- In February and March of 2020 as the COVID-19 pandemic began to affect Canadians, WD conducted research and analysis to support western Canadian businesses and residents. WD advocated for western needs during unprecedented economic circumstances. Concurrently, WD quickly and seamlessly pivoted to having all employees working from home and connected with its IT systems.
- The department is proud to host a great workplace where people can perform and achieve to their full potential. WD had the best Public Service Employee Survey (PSES) results of all federal departments that participated in the survey.
Operating context
The western Canadian economy is dependent on national fluctuations and global drivers and factors. Global GDP growth slowed to 2.9 percent in 2019, the weakest since the financial crisis, largely due to trade tensions, geo-political risks, and weaker investment flows.iii Canada’s real GDP growth slowed to an estimated 1.7 percent in 2019 – still the second-fastest growing economy among the G7 countries.
Western Canada accounted for approximately 37 percent of Canada’s economy in 2019 and nearly a third of the national population.iv, v Prior to the 2015-16 oil recession, the West had been at the forefront of national economic growth, growing on average at over four percent annually from 2010-2014. The oil shock induced recession of 2015-16 resulted in a 1.5 percent decline in output, followed by a moderate rebound and slow recovery. In 2019, the western provinces are estimated to have had some of the lowest growth nationally, stymied by trade restrictions, rail disruptions, slowing global demand, and continued lower prices for commodities.
In 2019, Alberta (-0.6%) and Saskatchewan (-0.8%) were the only two provinces in Canada that were showing signs of economic recession. Both provinces faced challenges after another oil price crash in late 2018 that led to oil production curtailments in Alberta, and reduced capital investment in both provinces. Both were affected by international trade restrictions on agricultural products. The unemployment rate in 2019 averaged 6.9 percent in Alberta, the highest among western provinces, and 5.4 percent in Saskatchewan.
Manitoba, the least resource-dependent western province, had growth of one percent in 2019. Global trade tensions not only affected its agricultural exports, but also weighed on its manufacturing output; downturns were seen in food manufacturing, and metal and machinery manufacturing. In addition, lower prices and demand continued to dampen the province’s mining sector. However, the province’s labour market improved, with unemployment falling to 5.4 percent in 2019 from 6 percent in the previous year.
British Columbia had the highest economic growth rate (+2.8%) in the West, and continued to have the lowest unemployment rate (4.7%) among all provinces in 2019. The contribution from the construction sector with the ramping up of the LNG Canada project had a significant impact. However, the province’s forestry sector remained under pressure with weak demand, lower prices, and the ongoing trade disputes that contributed to lower output and exports.
In addition to the economic challenges, socio-economic challenges in Western Canada continue to persist for under-represented groups, in particular Indigenous peoples, women, and youth.
The first quarter of 2020 presented even more challenges, as the COVID-19 pandemic emerged and economies shut down in March leading to reduced activity. Mandatory lockdown measures led to unprecedented declines in economic output particularly in the services sector and had a compounded effect on the already weak oil and gas sector. From February to March, employment fell by 293,000 across western Canada.
In 2019-20, WD’s Business scale-up and productivity and Regional Innovation Ecosystems program streams were fully implemented. The programs supported the advancement of growth, innovation, and diversification of the western economy, which included supporting businesses at various stages of development, and growing and cultivating inclusive regional ecosystems. In early 2020, the COVID-19 pandemic triggered a major economic crisis that would lead to an unprecedented fall in output and record unemployment across the west. WD nimbly shifted its focus to prepare for and address the immediate needs of western Canadians and enterprises.
Results: what we achieved
Core responsibility: Economic development in western Canada
Description:
Western Economic Diversification Canada (WD) promotes growth and diversification in the western Canadian economy by enhancing innovation, improving business competitiveness, promoting the adoption of clean technologies and inclusive growth.
Results
Based on WD’s core responsibility, the department works towards achieving its mandate through fulfilment of the following three departmental results:
- Businesses are innovative and growing in western Canada.
- Communities are economically diversified in western Canada.
- Businesses invest in the development and commercialization of innovative technologies in western Canada.
WD sets annual targets for all performance indicators at the departmental results and program inventory level in the departmental performance measurement framework (PMF).vi WD tracks progress against targets during the fiscal year. In addition, WD collects information on several non-PMF performance indicators to support accountability and programming decision-making.
WD’s three departmental results are interrelated and not mutually exclusive. To simplify the presentation of WD’s performance story, the department has structured this report to present each program’s outcomes achieved under only one departmental result even though it may contribute to more. Results achieved are presented as follows:
- The businesses departmental result presents programming delivered indirectly to businesses, through third parties, such as not-for-profit organizations or post-secondary institutions.
- The communities departmental result presents programming delivered through other funding mechanisms, including the Western Canada Business Service Network and targeted economic adjustment investments.
- The technologies departmental result presents programming delivered directly to businesses.
In 2019-20, WD focused its efforts on two departmental priorities to continue diversifying and developing the western Canadian economy. These two priorities are cluster growth and inclusiveness. Clusters are the building blocks for growing emerging industries and transforming traditional sectors. They bring together entrepreneurs, investors, anchor firms, and researchers to tackle common goals. In spring 2019, WD established four cluster priorities—Life Sciences, Cleantech, Value Added Agriculture, and Advanced Manufacturing—to enhance regional strengths and support the diversification of the Western Canadian economy. As an example, WD is working with stakeholders in the Saskatoon Food, Ingredient and Beverage Cluster to operationalize the cluster’s strategic plan to promote collaboration among firms, support investments in companies and organizations that enhance competitiveness, and optimize the use of food and ingredient co-products.
The department supported economic growth by building new relationships, strengthening existing ones, and increasing collaboration centered on key economic clusters of strength in western Canada. WD also made strategic investments to encourage an innovative and market-driven business ecosystem. At the same time, WD advanced its priority of promoting an inclusive economy that is representative of western Canada’s population. WD worked to create economic opportunities for under-represented groups, such as women, Indigenous peoples and youth, enabling them to enhance their contributions to western Canada’s economy.
WD also advanced its departmental inclusiveness priority, including a commitment to increase economic participation of Indigenous people, women, and youth. These groups face unique and systemic barriers. Adopting innovative approaches that build on regional strengths is essential for increasing their economic success and boosting growth in western Canada.
In 2019-20, WD conducted a Global Entrepreneurship Monitor (GEM) Study on women and youth in western Canada. The first of its kind in Canada, this study uses regionally-tailored data to produce analytical reports about women and youth entrepreneurs in the West. WD will use the findings from the study to inform policy decisions, make effective investments, and provide better advice to other government departments.
As a result of WD’s investment in regionally-tailored data, researchers in Saskatchewan and Manitoba have commissioned GEM reports for their respective provinces. WD is committed to sharing the benefits of this investment with a larger audience of government officials, researchers, and business service organizations across the West.
When the COVID-19 pandemic affected Canadians in the latter part of the fiscal year, WD responded by demonstrating great agility. It designed what would later become the Regional Relief and Recovery Fund (RRRF), a fund designed to help western Canadian businesses cope with the financial hardships resulting from COVID-19. This included creating a streamlined process to review and approve applications for funding. The modifications to WD’s usual approach accelerated the initial assessments of applications and allowed for WD staff to focus on performing advanced assessment on the stronger ones. WD’s business systems and information technology teams were instrumental in helping WD meet the needs of its clients during a time of urgency and need. Further, WD quickly and seamlessly pivoted to having all employees working from home and connected with its IT systems.
Western Canada Growth Strategy Results
In 2019-20, the Western Canada Growth Strategy achieved the following results:
- Approved mandate and established a governance structure with 10 co-lead ministries.
- Conducted research on priority initiatives including rural broadband, skills development and trade to inform strategic direction and partnerships development;
- Supported the development of regional economic profiles and provided regional intelligence.
- Advocated for western Canadian interests in national policy development such as the Universal Broadband Fund and community based immigration;
- Provided pathfinding support for alternative funding and partnership development.
The Western Canada Growth Strategy (also known as Grow West) is a call to action to explore ideas, build partnerships, convene, network, build knowledge and give a voice to western Canada’s economic needs and opportunities. It supports building western Canada’s economic future. A horizontal initiative, Grow West is co-led by 10 federal departments to pursue shared outcomes and government priorities. Grow West works across existing WD services, while leveraging those of co-lead departments.
Finally, WD collaborated with partners and stakeholders from Saskatchewan and across the Prairies to begin development of a Prairie-wide water management strategy. This work contributed to the announcement from the Province of Saskatchewan that it intends to advance two large irrigation projects in the province, leading to the creation of well-paying jobs, and increased agri-food production and exports. This work also highlighted potential benefits of enhanced collaboration and coordination on water management across the Prairies, which could be further advanced by provincial governments and other federal departments in the future.
Results:
Gender-based analysis plus
WD continues to take an inclusive approach to programming to support the economic development of western Canada, as well as its diverse population. The GBA+ Champion, departmental committee, and subject matter focal points keep up to date on GBA+ developments and integrate GBA+ into the policy cycle. Functional specialists from across WD have access to an on-line toolkit on how to integrate GBA+ into their work and into decision-making processes for programs, policy, and initiatives.
WD reviews and develops all projects with consideration of the impacts on women, youth, and Indigenous populations. It is too early to assess whether increased use of GBA+ has resulted in quantifiable impacts to inclusive programming.
Experimentation
Innovation and experimentation helps WD explore new ways to address challenges in meeting our mandate objectives and improve internal business processes. Examples of innovation within WD during 2019-20:
- Continued its practice of offering employee innovation funding to support great employee ideas, and of coordinating interdepartmental official language training for various proficiency levels.
- Launched a two-year performance management pilot that features a streamlined approach to employee performance appraisals in the hopes of reducing unnecessary documentation and focusing on the outcomes that matter: public servants feel engaged and equipped with the training, tools, and information they need to serve Canadians.
- Introduced Microsoft Teams software late in the fiscal year to enable employees to collaborate while they work from home.
- Independent evaluators were hired to conduct a first-ever longitudinal study to gather and analyze longer-term economic performance data of WD assisted recipients (both for-profit and non-profits).
- Developed a success story database to enable all WD regions to collaborate on storytelling and impact narratives. This database allows WD to collaborate on surfacing, screening and developing narratives about WD’s impact in the communities it serves.
WD-Saskatchewan has had a close and longstanding relationship with the Johnson-Shoyama Graduate School of Public Policy (JSGS), located at the University of Saskatchewan. In 2019, this relationship led to an experimentation in the content and delivery of the Innovation Policy course taught at JSGS, known as the Capstone project. WD-Saskatchewan worked with JSGS leadership to provide the students in the Innovation Policy class with a real-world example of a policy issue that WD-Saskatchewan was working on. These students applied the theory and course content from the Innovation Policy class into a final report and presentation that provided WD-Saskatchewan with timely information, insight, and discussions. WD-Saskatchewan, JSGS leadership, and the students in this class found this experimental format – whereby students get to apply their knowledge in a way that impacts WD’s work – to be an engaging and successful model. WD-Saskatchewan and JSGS leadership are working on providing another Capstone project to JSGS students in 2020-21.
Departmental Result: Businesses are innovative and growing in western Canada
WD tracks the following four performance indicators to capture the impact of this departmental result:
| Performance indicators | Target | Date to achieve target | 2017–18 Actual results |
2018–19 Actual results | 2019–20 Actual results |
|---|---|---|---|---|---|
| Value of exports of goods from western Canada ($) | $185.8B | March 31, 2020 | $181.8B | $207.7B | $209.3B |
| Value of exports of clean technologies from western Canada ($) | TBD | March 31, 2020 | n/a | n/a | $3.5B |
| Revenue growth rate of firms supported by WD programs1 | 7.5% | March 31, 2020 | 4.1% | 12.3% | 6.4%1-b |
| Number of high-growth firms in western Canada | 3,7832 | March 31, 2020 | 5,7103 | 3,6803-b | 3,4403-c |
1 Actual results are based on a three year lag.
2 The target and results for this indicator have been revised in the 2020-21 Departmental Plan to reflect changes in Statistics Canada’s methodology. The target had been set using the previous methodology.
3 There was a change in methodology used by Statistics Canada to measure the number of high-growth firms by revenue, and historical data has not yet been revised. This explains the variance between the target and result.
WD exceeded its target for the first indicator, value of exports of goods from western Canada. In 2019, western Canada’s exports grew by 0.8%. International trade disputes and rail disruptions were contributing factors to the modest growth. While these results outline western Canada’s performance as a whole, WD-funded projects also helped increase export sales of western Canadian businesses by $392 million in 2019-20.
WD exceeded its target for the first indicator, value of exports of goods from western Canada. In 2019, western Canada’s exports grew by 0.8%. International trade disputes and rail disruptions were contributing factors to the modest growth. While these results outline western Canada’s performance as a whole, WD-funded projects also helped increase export sales of western Canadian businesses by $392 million in 2019-20.
Project Spotlight:
Machine Intelligence Institute
To strengthen Alberta’s life sciences cluster, WD brought together a number of diverse organizations into an artificial intelligence (AI) -health innovation cluster that will enable the different stakeholders to leverage one another’s strengths in support of both individual and collective goals. The result is a $2.75M investment under RIE with Alberta Machine Intelligence Institute and involves several companies, research institutes, associations, post-secondary institutes, a health research network, a cardiac health clinic, and a medical lab all collaborating to achieve outcomes. This initiative strengthened the innovation ecosystem and is expected to result in 27 new technologies, 11 new intellectual property patents, $7.8M in sales revenues due to commercialization, $4.5M in export sales, and 32 new jobs.
For the second indicator, relating to exports of clean technologies from western Canada, data was previously not available. This is the reason for the “TBD” target. The 2019-20 result establishes a baseline that will be used to track progress in the future.
The third indicator, relating to revenue growth rate of firms supported by WD programs, missed its target because of lower than expected results by CF clients. Given the historical excellence of CFs, we will explore in the coming fiscal year this lower than expected result.
For the last indicator, the number of high-growth firms in western Canada, there was a one-time change in Statistics Canada’s methodology between the time the target was set and the results were collected. The new methodology uses one common source of data (as opposed to various), and as a result, caution should be exercised when comparing data year over year.
In 2019-20, WD approved $123.6 million in multi-year assistance for 66 projects under this departmental result. These projects supported ministerial mandate commitments and WD’s cluster growth and inclusiveness priorities, with a particular focus on the advanced manufacturing and digital technology sectors and Indigenous organizations. These projects aim to strengthen western Canada’s innovation ecosystem and support community economic development and diversification.
The regional innovation ecosystems (RIE) stream aims to create, grow, and nurture inclusive regional ecosystems that support business needs throughout the innovation continuum.
Another stream that generates results for western Canadians is the community economic development and diversification (CEDD). This stream makes strategic investments in projects that support innovation, business development or community economic growth throughout western Canada.
Project Spotlight:
Camosun College
To increase the participation of women in trades in British Columbia, WD invested $836,750 in Camosun College to implement a new multi-institutional pre-apprenticeship program. This initiative brought together the British Columbia Institute of Technology, Okanagan College, Industry Training Authority, the BC Ministry of Advanced Education, Skills, and Training, industry and other partners. Over three years, this project is expected to lead to the placement of 44 women into full-time Red Seal positions and establish an innovative and inclusive curriculum that will be delivered at all major trades training institutes in BC.
WD led the organization of four industry engagement events in western Canada that saw western Canadian companies and post-secondary institutions engage directly with defence prime contractors. One of these events was the Western Innovation Forum in March 2020 in Vancouver, which attracted over 300 participants from industry, academia and government. Participants were able to meet with representatives from 10 federal organizations and learn about business development funding and support programs. The event also featured nearly 300 business-to-business meetings where western Canadian industry and post-secondary institutions met face-to-face with defence sector prime contractors mainly to explore business opportunities related to the ITB Policy.
Departmental Result: Communities are economically diversified in western Canada
WD tracks the following two indicators to capture the impact of this departmental result:
| Performance indicators | Target | Date to achieve target | 2017–18 Actual results |
2018–19 Actual results | 2019–20 Actual results |
|---|---|---|---|---|---|
| Percentage of SMEs that are majority-owned by women, Indigenous people, youth, visible minorities and persons with disabilities in western Canada4 | Women: 15.6% Indigenous: 2.2% Visible minorities: 15.7% Youth: 16.2% Persons with disabilities: n/a5 |
March 31, 2020 | Women: 14.3% Indigenous: 1.4% Visible minorities: 10.6% Youth: 16.8% Persons with disabilities: n/a6 |
Women: 15.1% Indigenous: 2.2% Visible minorities: 15.1% Youth: 15.7% Persons with disabilities: 0.4% |
Women: 15.1% Indigenous: 2.2% Visible minorities: 15.1% Youth: 15.7% Persons with disabilities: 0.4% |
| Amount leveraged per dollar by WD in community projects | 1.3 | March 31, 2020 | 1.3 | 1.17 | 1.18 |
4 Actual results from 2018-19 and 2019-20 are based on the latest available data from 2017 Statistics Canada survey on financing and growth of SMEs. The survey is conducted every 3 years.
5 Target was not set for this group due to uncertainty in availability of data.
6 Actual results data were not available for this year.
7 Actual results exclude investments to restore the rail line to Churchill because their primary objective was supporting a community in need and not leveraging.
8 Actual results exclude investment to replace the Haisla bridge because its primary objective was supporting a community in need and not leveraging.
WD met or exceeded its target for one of the target sub-groups for the first performance indicator (Indigenous people). The share of majority-owned women SMEs fell short of WD’s target. According to the Global Entrepreneurship Monitor’s 2018 Canada Report, the rate of early-stage activity by women is increasing, however this activity has not translated into an increase in the number of established businesses as expected.
The share of majority-owned visible minorities SMEs missed its target, as did the share of majority-owned youth SMEs. Recent economic uncertainty could be a factor in the declining share of new youth-owned businesses. In the 2017 Global Entrepreneurship Monitor’s Report on Youth Entrepreneurship, youth’s perception of entrepreneurship opportunities has decreased since 2013. Going forward, the department will explore new programming options to continue supporting underrepresented groups in western Canada. Further, accessing the raw data might help us unpack the information and provide greater insight on this indicator.
The second indicator, amount leveraged per dollar by WD in community projects, did not achieve its target due to lower leveraging from a few key projects.
One of the primary delivery mechanisms for which WD delivered results under this departmental results is the Western Canada Business Service Network (WCBSN). The WCBSN is a group of independent organizations that receive WD funds to help western Canadians start, grow and expand their businesses. WD’s WCBSN partners provided 46,708 business advisory services to entrepreneurs and small and medium-sized businesses in rural and urban areas to help them grow and prosper. They also provided business training to 36,463 participants. WCBSN impacts included 7,124 jobs created, maintained or expanded through lending. In addition to the WCBSN results, WD partnered with the Canada Business Network in the West, which provided over 36,521 business information and advisory services.
The Community Futures (CFs) provided 1,323 loans to rural businesses worth $72.6 million that leveraged an additional $77.7 million. Of those loans in which entrepreneurs voluntarily self-identified, 328 loans were made to women, 263 to Indigenous clients, and 304 to youth. The CFs served a total of 28,781 clients over the course of the year. Of the clients served that self-identified, 3,689 identified as Indigenous, 7,718 as women, and 3,934 as youth.
A 2019-20 analysis of data from CFs regarding its loan clients, compared to similarly sized and located companies contained in Statistics Canada’s database, demonstrated continued superior results by CF clients as follows:
- In terms of employment growth from 2012 to 2017, CF-assisted firms collectively increased their number of employees by 6.82 percent compounded annually compared to 0.82 percent in non-assisted firms.
- In terms of sales growth from 2012 to 2017, CF-assisted firms exhibited 7.68 percent compounded annual sales growth rate compared to 2.49 percent for non-assisted firms. In addition, CF loan clients were able to withstand initial shocks due to economic activity better than firms without CF assistance. Sales growth of CF-assisted firms also tends to outperform sales growth of comparable firms during periods of economic slowdown.
- CF-assisted firms exhibited significantly stronger longevity at 65 percent for a 5-year survival rate than non-assisted firms at 46 percent.
A horizontal evaluation of the Community Futures Program was completed in 2019. The evaluation provided a national assessment of the performance of the Community Futures Program between 2013-14 and 2017-18, and its relevance. The evaluation determined that there is a strong need for continued federal economic development programming in the communities served by Community Futures Organizations, particularly for smaller and more remote communities. The evaluation concluded that the Community Futures Program has contributed to the achievement of its intended outcomes, especially those related to improved business financing and support services.
Project Spotlight:
Northern Village of Île a-la-Crosse
In Saskatchewan for example, the commercial fish industry did not have enough processing capacity in spite of the high volume of fish it produces. The Ile-a-la-Crosse fish processing plant had been packing fish for close to 60 years and the existing facility serviced the industry since the mid-1970's. However, the plant was aging and needed significant upgrades. Without the plant, the fishers faced significant reduction in the price for fish and even a loss of their livelihood. Beginning in 2015, WD provided $1,298,395 towards Northern Village of Île a-la-Crosse to construct a new Canadian Food Inspection Agency approved plant. The project, which was completed on March 31, 2020, resulted in significant efficiencies, enabling the plant to handle the increasing amount of fish delivered by local and regionally based fishers. The new facility has expanded the industry, bringing on a new generation of fishers. From April 1, 2019 to March 31, 2020, 15 full time jobs have been created directly related to the fish plant and 28 businesses have been created, maintained, or expanded. The project diversifies the economy of this northern community and supports Indigenous economic growth.
Another key program under this departmental result is the Women’s Enterprise Initiative (WEI). WEI organizations across western Canada provided 91 loans to women-owned businesses worth nearly $5.9 million. These loans in turn leveraged an additional $11.7 million from other funding sources, including financial institutions. The WEIs served 6,638 clients over the course of the year. Of these, 314 self-identified as Indigenous people.
With WD’s contribution of $2.18 million, the Francophone Economic Development Organizations (FEDOs) leveraged an additional $9.4 million from other funding sources to support new and ongoing community-based projects. The FEDOs served 1,905 clients over the course of the year. Of these, 33 self-identified as Indigenous people, 736 as women, and 591 as youth.
As part of the Women Entrepreneurship Strategy (WES), WD approved nearly $23.1 million in multi-year funding to 19 recipients under the WES Ecosystem Fund to strengthen capacity and close gaps in service for women entrepreneurs. As of March 31, 2020, WES Ecosystem Fund recipients have provided business services to over 2,830 clients.
Under WES, WD has recognized the value of building and enhancing linkages between the western service providers providing support to women entrepreneurs under the WES Ecosystem Fund, as well as providing direct support to women entrepreneurs through the WES Fund. These linkages have created synergies between organizations, and opened up opportunities for collaboration. This is a model that could be expanded to other similarly-designed programs.
As part of the Creating Middle Class Jobs: A Federal Tourism Growth Strategy, Budget 2019 announced the Canadian Experiences Fund (CEF), as a first major step in this strategy. In 2019-20, 74 projects representing $14.3 million in funding was approved over two years to support western Canadian businesses and not-for-profit organizations in creating, improving, or expanding tourism-related infrastructure. The CEF focuses on five categories: tourism in rural and remote communities; Indigenous tourism; winter tourism; culinary tourism; and inclusiveness, specifically for the LGBTQ2+ community. The COVID-19 pandemic has impacted recipients and their ability to meet expected results.
In 2016, the Government of Canada adopted the Pan-Canadian Framework on Clean Growth and Climate Change. This Framework announced amendments to regulations to phase out coal-fired electricity by 2030. Budget 2018 provided WD with $25 million over five years through the Canada Coal Transition Initiative to support the transition of these affected workers and communities to diversify their economies. In 2019-20, WD engaged with affected communities in Alberta and Saskatchewan to establish nearly $9M in projects to support various economic diversification initiatives including worker transition services, feasibility studies, investment attraction strategies, and business supports.
Project Spotlight:
Greater Victoria Visitors and Convention Bureau
The Greater Victoria Visitors and Convention Bureau is a CEF recipient that is implementing a $219,000 project to establish a four-season culinary and agri-tourism trail on the Saanich Peninsula. The recipient is a not-for-profit destination marketing organization for Greater Victoria. WD’s investment is helping the recipient offer a unique tourism experience and with its current cashflow crunch exacerbated by COVID-19, this WD support is very timely as it assists in the recovery of BC’s tourism sector.
WD invested $55 million to replace the aging Haisla Bridge in Kitimat, BC, as part of the federal government’s commitment to the LNG Canada project – the largest single project investment in Canadian history. This piece of critical infrastructure in the community will assist in developing the LNG Canada project and future industrial development in the area. This complex project was delivered through engagement with all levels of governments and First Nations.
Departmental Result: Businesses invest in the development and commercialization of innovative technologies in western Canada
WD tracks the following three indicators to capture the impact of this departmental result:
| Performance indicators | Target | Date to achieve target | 2017–18 Actual results |
2018–19 Actual results | 2019–20 Actual results |
|---|---|---|---|---|---|
| Value of business expenditures in research and development by firms receiving WD program funding ($) | $5.5M | March 31, 2020 | n/a9 | $21.3M | $15.8M |
| Percentage of professional jobs (including science and technology) in western Canada | 32.1% | March 31, 2020 | 32.1% | 32.4% | 32.8% |
| Percentage of companies engaged in collaborations with higher education institutions in western Canada10 | TBD11 | March 31, 2020 | n/a | 8.8% | 8.8% |
9 Actual results were not available for this year because this indicator was new commencing in fiscal year in 2018-19.
10 Actual results are based on the latest available data from the 2017 Statistics Canada survey of innovation and business strategy.
11 To be determined (TBD). Target was not set because baseline data was not available at the time.
WD met or exceeded its targets for all performance indicators under this departmental result (for which a target was set). For the first indicator, value of business expenditures in research and development (BERD) by firms receiving WD program funding, it is important to note that only a few projects expected BERD results at the time of target-setting.
For the last indicator, percentage of companies engaged in collaborations with higher education institutions in western Canada, data was previously not available. This is the reason for the “TBD” target. The 2018-19 and 2019-20 result establishes a baseline that will be used to track progress in the future.
Many of WD’s results under this departmental results came in WD’s five-year funding of the Western Innovation (WINN) Initiative (2013 to 2018), a program that provided repayable contributions to SMEs to support the commercialization of technologies or products, played an important role in helping western SMEs accelerate the commercialization of technologies and stimulate greater private sector investment. In 2019-20, the investment under WINN resulted in the creation of 567 jobs (including 445 highly qualified personnel) and over $133 million in sales growth resulting from commercialization.
Project Spotlight:
Nanalysis Corp.
In 2019-20, Nanalysis Corp. reported results including the creation of 9 highly qualified personnel jobs, over $8.1 million in export sales growth, and revenue growth of $6.3 million.
In Alberta, Nanalysis Corp. is a two-time WINN recipient. WD invested $2.77 million to support Calgary-based Nanalysis Corp. to further develop and commercialize a suite of innovative compact nuclear magnetic resonance (NMR) instrumentation and applications products based on NMR spectroscopy. Nanalysis earned the 2016 Frost & Sullivan global best practice company award, capitalizing on the growing global demand for compact NMR. In February 2020, Nanalysis won at the Nanotech Exhibition in Tokyo, Japan. The ultra-compact NMR spectrometer — awarded with the nano analytics Award for “best new analytical product” is a very rewarding outcome for this company. WD’s funding has helped Nanalysis Corp. scale up by doubling the size of its manufacturing facility in Calgary. As a market leader in compact spectroscopy, Nanalysis Corp. is expected to have applications in multiple industries including pharmacology, biotechnology, chemical, food processing, oil and gas, and environmental analysis.
Project Spotlight:
7shifts Scheduling Software
From April 1, 2019 to March 31, 2020, 7shifts Scheduling Software reported results including the creation of jobs for 18 highly qualified personnel, over $4.1 million in export sales growth, and revenue growth of $5.2 million.
In Saskatchewan, WD invested $3 million in 7shifts Scheduling Software to commercialize an enterprise scale version of its restaurant industry, cloud-based employee scheduling platform with state of the art machine learning and first of its kind functionality. These innovations provide significant operational improvements that address the challenges of restaurant operators and managers. Founded in Saskatoon, the app is used by over 350,000 restaurants around the world, including some major North American franchise chains.
Another driver of results for WD is the Business Scale-up and Productivity (BSP) program stream of REGI. This stream targeted businesses with high growth potential planning to grow by commercializing innovative technologies, enhancing productivity, scaling-up production, and expanding their market domestically and globally. From April 1, 2019 to March 31, 2020, the department’s investments resulted in the creation of 504 jobs (including 316 jobs for highly qualified personnel) and over $152 million in revenue growth.
WD prides itself on being an organization that learns as it goes. The department took steps to streamline and improve the BSP program for western Canada’s businesses and entrepreneurs. For example, in response to the needs of the business community, multiple opportunities were provided to apply for funds, instead of one call for proposals per year, as was the case in 2018-19.
Project Spotlight:
Redlen Technologies
The expected outcomes of the Redlen Technologies project include the creation of 60 jobs, of which 30 are highly qualified jobs, and generating over $42 million in export sales growth by 2022. To date, this project has created 22 jobs and achieved $3.6M in export sales growth.
Under the BSP program, WD invested $2.5 million in 2019-20 to support Redlen Technologies in Saanichton, BC, which provides multi-energy, x-ray imaging modules as solutions to medical imaging, security, and non-destructive testing problems. Building on the success of its WINN project, which commercialized a semiconductor radiation sensing technology, Redlen is now scaling-up to meet growing global demand from medical & security imaging companies.
Project Spotlight:
Levven Electronics Ltd.
The expected outcomes of the Levven Electronics Ltd. project include the creation of 32 jobs, of which 19 are highly qualified jobs, and generating $35 million in sales revenue, and $30 million in export sales revenue by 2023. To date, 6 jobs have been created and $4.4 million in revenue growth has been achieved.
In Alberta, WD invested $660,000 under the BSP program to support Levven Electronics Ltd., an Edmonton-based company. Levven scaled-up its business and marketing functions, and expanded its electronics manufacturing facility to produce intelligent control and audio products for homeowners and businesses. Levven's products help builders sell more homes, simplify the construction process, and increase labour productivity, resulting in cost savings that can be passed onto home homeowners and businesses. The project supports Alberta's advanced manufacturing and digital technology sectors. Levven is also an Accelerated Growth Strategy (AGS) success story.
Project Spotlight:
Vidir Solutions
In Manitoba, Vidir Solutions manufactures vertical storage systems for retail stores and bed storage systems for hospitals. Through a $1 million Steel and Aluminum Initiative investment, the company was able to create eleven new products using its new fibre laser cutting equipment, including an automated storage and retrieval system, to help hospitals and clinics manage an increase in demand for beds due to the COVID-19 pandemic.
WD responds to the needs of western Canadian businesses. For example, the Steel and Aluminum Initiative (SAI) for small and medium-sized steel and aluminum manufacturers and users supported 43 projects with an investment of $24.99 million to enhance productivity, increase competitiveness, and create more highly skilled jobs. In 2019-20, SAI investments resulted in 256 jobs (including 155 highly qualified personnel), over $48 million in revenue growth, and nearly $14 million in export sales.
Results achieved
WD takes a patient, long-term approach to economic development. Many investments are multi-year in duration and require several years to realize results and economic outcomes. Consequently, there is more information available at the activities and outputs level than on outcomes and impacts. Analyzing historical data over a year-by-year basis may not be an accurate way to forecast or compare results. WD is addressing this in part by conducting a longitudinal study to understand the longer-term impacts of its investments in both the for-profit and not-for-profit sectors.
The department uses several sources of data to monitor progress against its performance indicators. Due to the frequency of some surveys and the availability of data, there may be a time lag of up to three years in results for some indicators.
| Departmental results | Performance indicators | Target | Date to achieve target | 2017–18 Actual results |
2018–19 Actual results | 2019–20 Actual results |
|---|---|---|---|---|---|---|
| Businesses are innovative and growing in western Canada | Value of exports of goods from western Canada ($) | $185.8B | March 31, 2020 | $181.8B | $207.7B | $209.3B |
| Revenue growth rate of firms supported by WD programs12 | 7.5% | March 31, 2020 | 4.1% | 12.3% | 6.4%12 | |
| Value of exports of clean technologies from western Canada ($) | TBD | March 31, 2020 | n/a | n/a | $3.5B | |
| Number of high-growth firms in western Canada | 3,78313 | March 31, 2020 | 5,71014 | 3,68014-b | 3,44014-c | |
| Communities are economically diversified in western Canada | Percentage of SMEs that are majority-owned by women, Indigenous people, youth, visible minorities and persons with disabilities in western Canada15 | Women: 15.6% Indigenous: 2.2% Visible minorities: 15.7% Youth: 16.2% Persons with disabilities: n/a16 |
March 31, 2020 | Women: 14.3% Indigenous: 1.4% Visible minorities: 10.6% Youth: 16.8% Persons with disabilities: n/a17 |
Women: 15.1% Indigenous: 2.2% Visible minorities: 15.1% Youth: 15.7% Persons with disabilities: 0.4% |
Women: 15.1% Indigenous: 2.2% Visible minorities: 15.1% Youth: 15.7% Persons with disabilities: 0.4% |
| Amount leveraged per dollar by WD in community projects | 1.3 | March 31, 2020 | 1.3 | 1.118 | 1.119 | |
| Businesses invest in the development and commercialization of innovative technologies in western Canada | Value of business expenditures in research and development by firms receiving WD program funding ($) | $5.5M | March 31, 2020 | n/a20 | $21.3M | $15.8M |
| Percentage of professional jobs (including science and technology) in western Canada | 32.1% | March 31, 2020 | 32.1% | 32.4% | 32.8% | |
| Percentage of companies engaged in collaborations with higher education institutions in western Canada21 | TBD22 | March 31, 2020 | n/a | 8.8% | 8.8% |
12 Actual results are based on a three year lag.
13 The target and results for this indicator have been revised in the 2020-21 Departmental Plan to reflect changes in Statistics Canada’s methodology. The target had been set using the previous methodology.
14 There was a change in methodology used by Statistics Canada to measure the number of high-growth firms by revenue, and historical data has not yet been revised. This explains the variance between the target and the result.
15 Actual results from 2018-19 and 2019-20 are based on the latest available data from 2017 Statistics Canada survey on financing and growth of SMEs. The survey is conducted every 3 years.
16 Target was not set for this group due to uncertainty in availability of data.
17 Actual results data were not available for this year.
18 Actual results exclude investments to restore the rail line to Churchill because their primary objective was supporting a community in need and not leveraging.
19 Actual results exclude investment to replace the Haisla bridge because its primary objective was supporting a community in need and not leveraging.
20 Actual results were not available for this year because this indicator was new commencing in fiscal year in 2018-19.
21 Actual results are based on the latest available data from the 2017 Statistics Canada survey of innovation and business strategy.
22 To be determined (TBD). Target was not set because baseline data was not available at the time.
Budgetary financial resources (dollars)
| 2019–20 Main Estimates |
2019–20 Planned spending |
2019–20 Total authorities available for use |
2019–20 Actual spending (authorities used) |
2019–20 Difference (Actual spending minus Planned spending) |
|---|---|---|---|---|
| 293,820,063 | 293,820,063 | 304,330,427 | 295,440,866 | 1,620,803 |
Human resources (full-time equivalents)
| 2019–20 Planned full-time equivalents |
2019–20 Actual full-time equivalents |
2019–20 Difference (Actual full-time equivalents minus Planned full-time equivalents) |
|---|---|---|
| 211 | 237 | 26 |
Note: Actual FTE utilization is higher than planned because of increased activities to support Business Scale-up and Productivity, and Regional Innovation Ecosystem program streams, as well as for the Launching of a Federal Strategy on Jobs and Tourism.
Financial, human resources and performance information for WD’s Program Inventory is available in GC InfoBasevii.
Internal Services
Description
Internal Services are those groups of related activities and resources that the federal government considers to be services in support of programs and/or required to meet corporate obligations of an organization. Internal Services refers to the activities and resources of the 10 distinct service categories that support Program delivery in the organization, regardless of the Internal Services delivery model in a department. The 10 service categories are:
- Acquisition Management Services
- Communication Services
- Financial Management Services
- Human Resources Management Services
- Information Management Services
- Information Technology Services
- Legal Services
- Material Management Services
- Management and Oversight Services
- Real Property Management Services
Results
WD is a great place to work. The department was acknowledged as a Top 75 employer in Alberta for 2020 and received accolades in a number of newspapers (Ottawa Citizen, Edmonton Journal, Calgary Herald, Hill Times) for having a great work environment. WD’s particularly strong results from the 2019 Public Service Employee Survey (PSES) include:
- 92 percent of respondents feel that people they work with value their ideas and opinions (compared to 79% for the public service);
- 92 percent would recommend WD as a great place to work (compared to 70% for the public service); and
- 88 percent feel encouraged to be innovative or take initiative at work (compared to 68% for the public service).
WD was part of a Treasury Board of Canada initiative to develop a common Grants and Contributions (G&C) program management platform for the six Regional Development Agencies (RDAs), and to provide a foundation for other interested Government of Canada departments. The RDAs worked collaboratively to develop a common software platform for G&C project delivery to replace their respective aging legacy G&C solutions. The final base platform called Grants and Contributions Program Management (GCPM) was received by the RDAs in July 2019. WD continues to collaborate with the other RDAs as it integrates the platform on the cloud using Microsoft Dynamics CRM and Portal (Microsoft D365).
As part of the Workplace 2.0 initiative, WD’s regional office in Vancouver completed a successful move to a new location in 2019-20. This decreased costs and improved efficiencies.
PSD’s Communications Operations team increased the department’s presence on social media. During the 2019-20 fiscal year, the department’s LinkedIn account gained 3,616 new followers, an increase of 180% compared to the same period in 2018-19. Additionally, the department’s Twitter account also saw an increase in followers, with an increase of 619 new followers, up 9.9% from 2018-19. WD’s translation team managed 1,146 translation requests in 2019-20, a significant increase in workload from the previous year.
In 2019-20, WD employees were paid accurately and on time. In several consecutive annual surveys WD employees have reported very low levels of stress due to pay or compensation related issues, and very high levels of satisfaction with the support they received from WD to resolve pay issues.
All WD employees were provided with remote work capabilities as the department transitioned seamlessly to working from home by using innovative IT solutions and pivoting to meet the extraordinary circumstances that COVID-19 presented.
Budgetary financial resources (dollars)
| 2019–20 Main Estimates |
2019–20 Planned spending |
2019–20 Total authorities available for use |
2019–20 Actual spending (authorities used) |
2019–20 Difference (Actual spending minus Planned spending) |
|---|---|---|---|---|
| 11,496,953 | 11,496,953 | 12,184,578 | 13,639,563 | 2,142,610 |
Note: Increased authorities spending is attributed to additional funding received related to Budget 2019 initiatives for Regional Economic Growth through Innovation (REGI), the operating budget carry forward and collective bargaining agreement settlements.
Human resources (full-time equivalents)
| 2019–20 Planned full-time equivalents |
2019–20 Actual full-time equivalents |
2019–20 Difference (Actual full-time equivalents minus Planned full-time equivalents) |
|---|---|---|
| 89 | 97 | 8 |
Analysis of trends in spending and human resources
Actual expenditures
Departmental spending trend graph
The following graph presents planned (voted and statutory spending) over time.
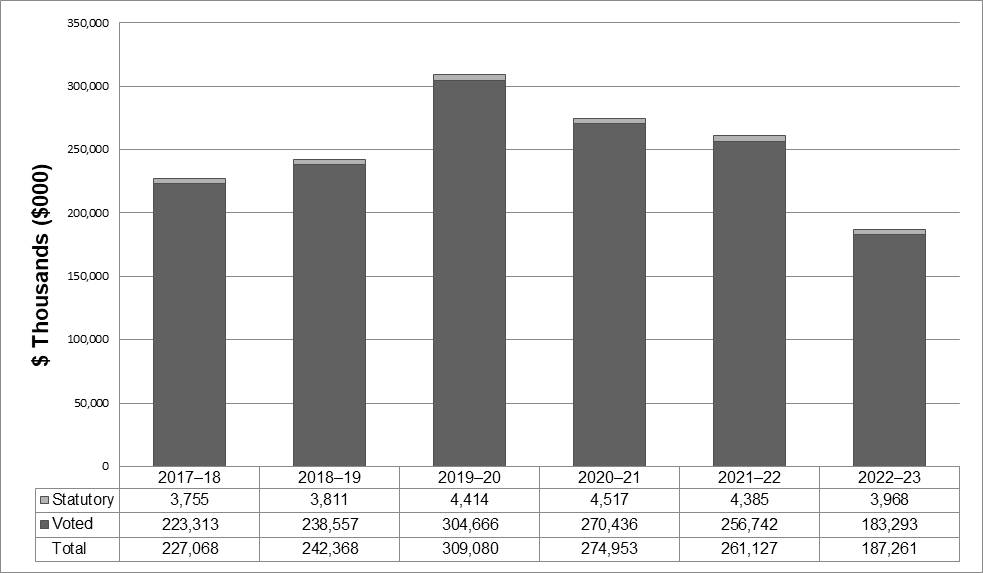
The figures presented in the chart above reflect the impact the Budget 2019 had on the department’s overall spending. Actual and planned spending increased in 2019-20 and 2020-21 as a result of Budget 2019 initiatives for Regional Economic Growth through Innovation (REGI), support for Canadian steel and aluminum small and medium-sized enterprises, the LNG Haisla Bridge project, and the Federal Strategy on Jobs and Tourism to establish the Canadian Experiences Fund.
Budgetary performance summary for Core Responsibilities and Internal Services (dollars)
| Core responsibilities and Internal Services | 2019–20 Main Estimates |
2019–20 Planned spending |
2020–21 Planned spending |
2021–22 Planned spending |
2019–20 Total authorities available for use |
2019–20 Actual spending (authorities used) | 2018–19 Actual spending (authorities used) | 2017–18 Actual spending (authorities used) |
|---|---|---|---|---|---|---|---|---|
| Economic Development in western Canada | 293,820,063 | 293,820,063 | 261,980,294 | 248,664,429 | 304,330,427 | 295,440,866 | 228,742,960 | 213,955,950 |
| Subtotal | 293,820,063 | 293,820,063 | 261,980,294 | 248,664,429 | 304,330,427 | 295,440,866 | 228,742,960 | 213,955,950 |
| Internal Services | 11,496,953 | 11,496,953 | 12,972,679 | 12,462,714 | 12,184,578 | 13,639,563 | 13,624,581 | 13,112,169 |
| Total | 305,317,016 | 305,317,016 | 274,952,973 | 261,127,143 | 316,515,005 | 309,080,429 | 242,367,541 | 227,068,119 |
Actual human resources
Human resources summary for Core responsibilities and Internal Services
| Core responsibilities and Internal Services | 2017–18 Actual full-time equivalents | 2018–19 Actual full-time equivalents | 2019–20 Planned full-time equivalents |
2019–20 Actual full-time equivalents | 2020–21 Planned full-time equivalents | 2021–22 Planned full-time equivalents |
|---|---|---|---|---|---|---|
| Economic Development in western Canada | 202 | 212 | 211 | 237 | 232 | 232 |
| Subtotal | 202 | 212 | 211 | 237 | 232 | 232 |
| Internal Services | 91 | 97 | 89 | 97 | 95 | 95 |
| Total | 293 | 309 | 300 | 334 | 327 | 327 |
Expenditures by vote
For information on WD’s organizational voted and statutory expenditures, consult the Public Accounts of Canada 2019–2020.viii
Government of Canada spending and activities
Information on the alignment of WD’s spending with the Government of Canada’s spending and activities is available in GC InfoBase.ix
Financial statements and financial statements highlights
Financial statements
The WD’s financial statements (unaudited) for the year ended March 31, 2020, are available on the departmental website.
Financial statement highlights
Condensed Statement of Operations (unaudited) for the year ending March 31, 2020 (dollars)
| Financial information | 2019–20 Planned results* |
2019–20 Actual results |
2018–19 Actual results |
Difference (2019–20 Actual results minus 2019–20 Planned results) |
Difference (2019–20 Actual results minus 2018–19 Actual results) |
|---|---|---|---|---|---|
| Total expenses | 224,547,654 | 246,744,732 | 206,177,388 | 22,197,078 | 40,567,344 |
| Total revenues | 6,635 | 446 | 11,976 | (6,189) | (11,530) |
| Net cost of operations before government funding and transfers | 224,541,019 | 246,744,286 | 206,165,412 | 22,203,267 | 40,578,874 |
* WD’s Future-Oriented Statement of Operations (unaudited) for the year ended March 31, 2020, are available on the departmental website.
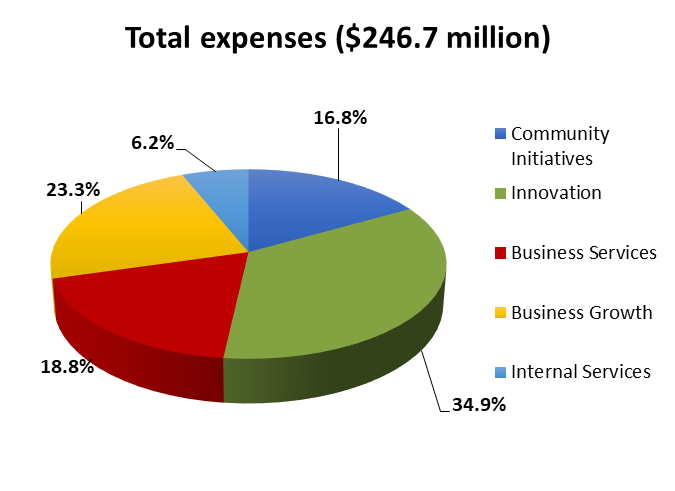
Total expenses were $246.7 million in 2019-20, a net increase of $40.6 million (20 percent) over 2018-19. This year-over-year net increase is attributed primarily to additional transfer payment expenses under Regional Economic Growth through Innovation Program ($67.9 million), Canadian Experiences Fund ($4.9 million) and the Canada Coal Transition Initiative ($1.8 million) offset by decreased expenses for the restoration of the Hudson Bay rail line and reopening of the Port of Churchill (34.0 million).
Condensed Statement of Financial Position (unaudited) as of March 31, 2020 (dollars)
| Financial information | 2019–20 | 2018–19 | Difference (2019–20 minus 2018–19) |
|---|---|---|---|
| Total net liabilities | 80,153,182 | 48,109,533 | 32,043,649 |
| Total net financial assets | 77,024,521 | 45,610,919 | 31,413,602 |
| Departmental net debt | (3,128,661) | (2,498,614) | (630,047) |
| Total non-financial assets | 1,181,174 | 1,044,504 | 136,670 |
| Departmental net financial position | (1,947,487) | (1,454,110) | (493,377) |

Total net liabilities were $80.2 million at the end of 2019–20, a net increase of $32.1 million (67 percent) over 2018–19. This year-over-year net increase is attributed to the establishment of accounts payable balances for the Regional Economic Growth through Innovation program and reductions in accounts payable funded under the Canada 150 Community Infrastructure Program.
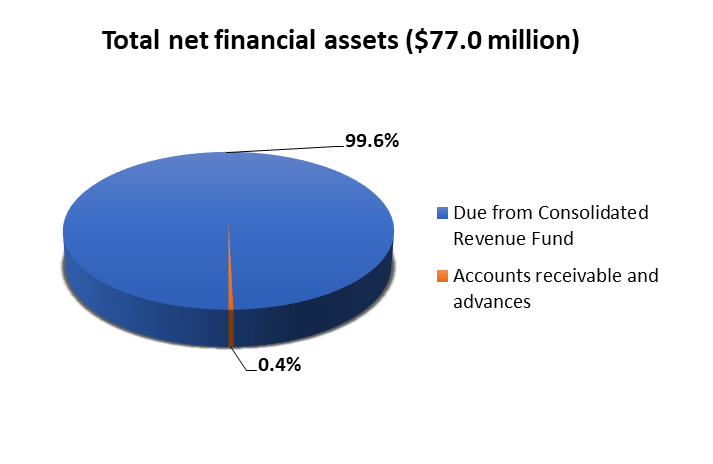
Total net financial assets were $77.0 million at the end of 2019–20, an increase of $31.4 million (69 percent) over 2018–19. This year-over-year increase in these assets primarily consists of the "Due from Consolidated Revenue Fund" ($76.7 million), which is used to discharge WD's liabilities. Given WD's liabilities were higher than the previous fiscal year, the "Due from Consolidated Revenue Fund" also increased.
Additional information
Organizational profile
Appropriate minister: The Honourable Melanie Joly, P.C., M.P.
Institutional head: Dylan Jones
Ministerial portfolio: Innovation, Science and Economic Development
Enabling instrument[s]: Western Economic Diversification Act, R.S.C. 1985, c.11, (4th Supplement)
Year of incorporation / commencement: 1987
Other:
Headquarters - Edmonton, Alberta
Offices - Vancouver, British Columbia
Edmonton and Calgary, Alberta
Saskatoon, Saskatchewan
Winnipeg, Manitoba
Ottawa, Ontario
Raison d’être, mandate and role: who we are and what we do
“Raison d’être, mandate and role: who we are and what we do” is available on WD’s website.
For more information on the department’s organizational mandate letter commitments, see the Minister’s mandate letter.
Reporting framework
WD’s Departmental Results Framework and Program Inventory of record for 2019–20 are shown below.
| Departmental Results Framework | Core Responsibility: Economic development in western Canada | Internal Services | |
| Departmental result: Businesses are innovative and growing in western Canada |
Indicator: Value of exports of goods from western Canada ($) | ||
| Indicator: Number of high-growth firms in western Canada | |||
| Indicator: Value of exports of clean technologies from western Canada ($) | |||
| Indicator: Revenue growth rate of firms supported by WD programs | |||
| Departmental result: Communities are economically diversified in western Canada |
Indicator: Percentage of SMEs that are majority-owned by women, Indigenous people, youth, visible minorities and persons with disabilities in western Canada | ||
| Indicator: Amount leveraged per dollar by WD in community projects | |||
| Departmental result: Businesses invest in the development and commercialization of innovative technologies in western Canada |
Indicator: Value of business expenditures in research and development by firm receiving WD program funding ($) | ||
| Indicator: Percentage of professional jobs (including science and technology) in western Canada | |||
| Indicator: Percentage of companies engaged in collaborations with higher education institutions in western Canada | |||
| Program Inventory | Program: Innovation | ||
| Program: Business Growth | |||
| Program: Business Services | |||
| Program: Community Initiatives | |||
Supporting information on the program inventory
Financial, human resources and performance information for WD’s Program Inventory is available in GC InfoBase.x
Supplementary information tables
The following supplementary information tables are available on WD’s website - Supplementary Information:
- Departmental Sustainable Development Strategy
- Details on transfer payment programs of $5 million or more
- Gender-based analysis plus
- Response to Parliamentary Committees and External Audits
- Up-front multi-year funding
Federal tax expenditures
The tax system can be used to achieve public policy objectives through the application of special measures such as low tax rates, exemptions, deductions, deferrals and credits. The Department of Finance Canada publishes cost estimates and projections for these measures each year in the Report on Federal Tax Expenditures.xi This report also provides detailed background information on tax expenditures, including descriptions, objectives, historical information and references to related federal spending programs. The tax measures presented in this report are the responsibility of the Minister of Finance.
Organizational contact information
Western Economic Diversification Canada
Suite 1500, 9700 Jasper Avenue
Edmonton, Alberta T5J 4H7
Telephone: 780-495-4164
Fax: 780-495-4557
Web: www.wd-deo.gc.ca
Appendix: definitions
appropriation (crédit)
Any authority of Parliament to pay money out of the Consolidated Revenue Fund.
budgetary expenditures (dépenses budgétaires)
Operating and capital expenditures; transfer payments to other levels of government, organizations or individuals; and payments to Crown corporations.
core responsibility (responsabilité essentielle)
An enduring function or role performed by a department. The intentions of the department with respect to a core responsibility are reflected in one or more related departmental results that the department seeks to contribute to or influence.
Departmental Plan (plan ministériel)
A report on the plans and expected performance of an appropriated department over a 3-year period. Departmental Plans are usually tabled in Parliament each spring.
departmental priority (priorité)
A plan or project that a department has chosen to focus and report on during the planning period. Priorities represent the things that are most important or what must be done first to support the achievement of the desired departmental results.
departmental result (résultat ministériel)
A consequence or outcome that a department seeks to achieve. A departmental result is often outside departments’ immediate control, but it should be influenced by program-level outcomes.
departmental result indicator (indicateur de résultat ministériel)
A quantitative measure of progress on a departmental result.
departmental results framework (cadre ministériel des résultats)
A framework that connects the department’s core responsibilities to its departmental results and departmental result indicators.
Departmental Results Report (rapport sur les résultats ministériels)
A report on a department’s actual accomplishments against the plans, priorities and expected results set out in the corresponding Departmental Plan.
experimentation (expérimentation)
The conducting of activities that seek to first explore, then test and compare the effects and impacts of policies and interventions in order to inform evidence-based decision-making, and improve outcomes for Canadians, by learning what works, for whom and in what circumstances. Experimentation is related to, but distinct from innovation (the trying of new things), because it involves a rigorous comparison of results. For example, using a new website to communicate with Canadians can be an innovation; systematically testing the new website against existing outreach tools or an old website to see which one leads to more engagement, is experimentation.
full-time equivalent (équivalent temps plein)
A measure of the extent to which an employee represents a full person-year charge against a departmental budget. For a particular position, the full-time equivalent figure is the ratio of number of hours the person actually works divided by the standard number of hours set out in the person’s collective agreement.
gender-based analysis plus (GBA+) (analyse comparative entre les sexes plus [ACS+])
An analytical process used to assess how diverse groups of women, men and gender-diverse people experience policies, programs and services based on multiple factors including race ethnicity, religion, age, and mental or physical disability.
government-wide priorities (priorités pangouvernementales)
For the purpose of the 2019–20 Departmental Results Report, those high-level themes outlining the government’s agenda in the 2019 Speech from the Throne, namely: Fighting climate change; Strengthening the Middle Class; Walking the road of reconciliation; Keeping Canadians safe and healthy; and Positioning Canada for success in an uncertain world.
horizontal initiative (initiative horizontale)
An initiative where two or more federal organizations are given funding to pursue a shared outcome, often linked to a government priority.
non-budgetary expenditures (dépenses non budgétaires)
Net outlays and receipts related to loans, investments and advances, which change the composition of the financial assets of the Government of Canada.
performance (rendement)
What an organization did with its resources to achieve its results, how well those results compare to what the organization intended to achieve, and how well lessons learned have been identified.
performance indicator (indicateur de rendement)
A qualitative or quantitative means of measuring an output or outcome, with the intention of gauging the performance of an organization, program, policy or initiative respecting expected results.
performance reporting (production de rapports sur le rendement)
The process of communicating evidence-based performance information. Performance reporting supports decision making, accountability and transparency.
plan (plan)
The articulation of strategic choices, which provides information on how an organization intends to achieve its priorities and associated results. Generally, a plan will explain the logic behind the strategies chosen and tend to focus on actions that lead to the expected result.
planned spending (dépenses prévues)
For Departmental Plans and Departmental Results Reports, planned spending refers to those amounts presented in Main Estimates.
A department is expected to be aware of the authorities that it has sought and received. The determination of planned spending is a departmental responsibility, and departments must be able to defend the expenditure and accrual numbers presented in their Departmental Plans and Departmental Results Reports.
program (programme)
Individual or groups of services, activities or combinations thereof that are managed together within the department and focus on a specific set of outputs, outcomes or service levels.
program inventory (répertoire des programmes)
Identifies all the department’s programs and describes how resources are organized to contribute to the department’s core responsibilities and results.
result (résultat)
A consequence attributed, in part, to an organization, policy, program or initiative. Results are not within the control of a single organization, policy, program or initiative; instead they are within the area of the organization’s influence.
statutory expenditures (dépenses législatives)
Expenditures that Parliament has approved through legislation other than appropriation acts. The legislation sets out the purpose of the expenditures and the terms and conditions under which they may be made.
target (cible)
A measurable performance or success level that an organization, program or initiative plans to achieve within a specified time period. Targets can be either quantitative or qualitative.
voted expenditures (dépenses votées)
Expenditures that Parliament approves annually through an appropriation act. The vote wording becomes the governing conditions under which these expenditures may be made.
- Date modified: