
2014-15 Departmental Performance Report
ISSN 2368-0954
Table of Contents
Erratum
Western Economic Diversification Canada
Subsequent to tabling in Parliament and online publication of the 2014-15 Departmental Performance Report, Western Economic Diversification Canada identified an error in Section 1 tables titled "Alignment of 2014-15 Actual Spending with the Whole-of-Government Framework (dollars)" and "Total Spending by Spending Area (dollars)".
These two tables included internal services which should have been excluded.
This error has now been corrected in both the English and French PDF and HTML versions of report posted online.
Section I: Organizational Expenditure Overview
- Organizational Profile
- Organizational Context
- Actual Expenditures
- Alignment of Spending With Whole-of-Government Framework
- Departmental Spending Trend
- Expenditures by Vote
Section II: Analysis of Programs by Strategic Outcome
- Strategic Outcome
- Program 1.1: Business Development and Innovation
- Sub-program 1.1.1: Trade, Investment and Market Access
- Sub-program 1.1.2: Business Productivity and Growth
- Sub-program 1.1.3: Innovation Capacity Building
- Sub-program 1.1.4: Technology Commercialization
- Program 1.2: Community Economic Growth
- Sub-program 1.2.1: Infrastructure Programming
- Sub-program 1.2.2: Community Development
- Sub-program 1.2.3: Community Futures Program
- Sub-program 1.2.4: Targeted Economic Initiatives
- Program 1.3: Policy, Advocacy and Coordination
- Sub-program 1.3.1: Advocacy and Coordination
- Sub-program 1.3.2: Economic Analysis
- Internal Services
Section III: Supplementary Information
- Financial Statements Highlights
- Financial Statements
- Supplementary Information Tables
- Tax Expenditures and Evaluations
Section IV: Organizational Contact Information
Ministers' Message
We are pleased to report on Western Economic Diversification Canada’s key activities in 2014–15.
Our overarching goals within the Innovation, Science and Economic Development portfolio are to help Canadian businesses grow, innovate and export so that they can spur economic development and create good quality jobs and wealth for Canadians in all regions across the country; to help small businesses grow through trade and innovation; to promote increased tourism to Canada; to promote and support scientific research and the integration of scientific considerations in our investment and policy choices. We are committed to working closely with colleagues and stakeholders from all of these diverse fields to achieve these objectives.
We are pleased to present the 2014–15 Departmental Performance Report for Western Economic Diversification Canada.

The Honourable Navdeep Bains
Minister of Innovation, Science
and Economic Development

The Honourable Kirsty Duncan
Minister of Science

The Honourable Bardish Chagger
Minister of Small Business and Tourism
Section I: Organizational Expenditure Overview
Organizational Profile
Minister of Innovation, Science and Economic Development
The Honourable Navdeep Bains, P.C., M.P.
- The Honourable Rona Ambrose, P.C., M.P. (responsible Minister for 2014-15)
- The Honourable Michelle Rempel, P.C., M.P. (responsible Minister of State for 2014-15)
Minister of Science:
The Honourable Kirsty Duncan, P.C., M.P.
Minister of Small Business and Tourism:
The Honourable Bardish Chagger, P.C., M.P.
Deputy Head: Daphne Meredith
Ministerial Portfolio:
Western Economic Diversification Canada
Enabling Instrument: Western Economic Diversification Act i
Year of Incorporation / Commencement: 1987
Other:
WD was created on August 4, 1987 as a special operating agency and officially became a federal department through the Western Economic Diversification Act, which came into force June 28, 1988.
Headquarters: Edmonton, Alberta
Offices:
Vancouver, BC
Edmonton and Calgary, AB
Saskatoon, SK
Winnipeg, MB
Ottawa, ON
Organizational Context
Raison d'être
Western Economic Diversification Canada (WD) was established in 1987 to promote the development and diversification of the economy of Western Canada and to advance the interests of the West in national economic policy, program and project development and implementation. The Minister of Innovation, Science and Economic Development is responsible for this organization.
As the department responsible for regional development in Western Canada, WD develops and supports economic policies, programs and activities to promote economic growth throughout Western Canada.
Responsibilities
Our Vision
To be leaders in creating a more diversified western Canadian economy that has strong, competitive and innovative businesses and communities.
WD's mandate, derived from the Western Economic Diversification Act, is to develop and diversify the western Canadian economy. This broad mandate allows the Department to implement programs and initiatives across the West to help western Canadians create strong, competitive and innovative businesses and communities.
With offices in each western province and its headquarters in Edmonton, WD provides a strong federal presence to promote economic development in the West. Its western base has enabled the Department to foster extensive partnerships across Western Canada with business and community organizations, research and academic institutions, Aboriginal groups as well as provincial and municipal governments.
These connections enable the Department to identify and support economic opportunities in the West and to leverage its investments to benefit the western Canadian economy. In addition, through its strong connections with federal departments across Canada and its office in Ottawa, WD ensures that western interests and perspectives are reflected in national policy development and decision-making.
WD focuses its activities in three program areas:
Launched in May 2014, the WDP Call for Proposals process allows for a comparative analysis of projects against clear criteria; strengthens the department's responsiveness to economic trends and industry needs; and ensures alignment with Government of Canada plans and priorities.
Business Development and Innovation: WD helps small and medium-sized enterprises (SME) develop and grow, create jobs, expand their markets, increase their exports and become more innovative and productive. The Department assists SMEs with international business engagement and works to attract investment to the region, as well as assist western Canadian SMEs to access opportunities linked to government procurement. Further, WD promotes the development and growth of the knowledge-based economy by building innovation capacity and supporting the commercialization of new knowledge-based products, processes and services.
Community Economic Growth: WD helps communities sustain their local economies and adjust to changing economic circumstances through departmental programs and by delivering national initiatives on behalf of the Government of Canada in Western Canada. WD also supports community-based organizations that provide western entrepreneurs with the information, training and loans they need to start and grow their businesses.
Policy, Advocacy and Coordination: WD identifies opportunities to strengthen the western Canadian economy and coordinate economic development activities, policies and programs across the West. WD works to build strategic relationships with key decision makers across Canada and works with western Canadian industry on defence-related procurement opportunities.
WD's Grants and Contributions support projects delivered directly by WD, either alone or in partnership with other organizations. The Western Innovation (WINN) Initiative offers repayable contributions for SMEs with operations in Western Canada to move their new and innovative technologies from the later stages of research and development to the marketplace. The Western Diversification Program (WDP) invests in projects that support WD's activities of innovation, business development, community economic development and policy, advocacy and coordination. The Western Canada Business Service Network (WCBSN) is a network of several independent organizations that receive funding from WD to provide a range of services to help create and build small businesses across the West. WCBSN members include Canada Business Network (CBN) Community Futures (CF), Women's Enterprise Initiative (WEI), Francophone Economic Development Organizations (FEDO), Aboriginal Business Service Network (ABSN) and Entrepreneurs with Disabilities (EDP).
In addition, utilizing the Department's flexibility and ability to respond quickly to the priorities and needs of the West, WD has continued to deliver national initiatives on behalf of the federal government in Western Canada. These include the Building Canada Fund, Community Infrastructure Improvement Fund (CIIF), and the Canada Strategic Infrastructure Fund on behalf of Infrastructure Canada (programming to upgrade and expand western Canadian infrastructure), funding to the Rick Hansen Foundation to help improve the lives of people living with spinal cord injuries, as well as the Economic Development Initiative (EDI) aimed at supporting businesses and economic development in western Canadian Francophone communities.
WD is an important contributor to a prosperous western Canadian economy and works to build on the West's traditional economic strengths while supporting the transition to a more diverse economy.
Strategic Outcome and Program Alignment Architecture
In 2014–15, WD's Program Alignment Architecture included the following programs and sub-programs that contributed to the achievement of its Strategic Outcome, helping to ensure that Western Canada continues to make a strong contribution to Canada's economic success. Detailed information about WD's Strategic Outcome, each program and sub-program can be found in Section II: Analysis of Programs by Strategic Outcome.
- Strategic Outcome: A growing and diversified western Canadian economy
-
1.1 Program: Business Development and Innovation
- 1.1.1 Sub-Program: Trade, Investment and Market Access
- 1.1.2 Sub-Program: Business Productivity and Growth
- 1.1.3 Sub-Program: Innovation Capacity Building
- 1.1.4 Sub-Program: Technology Commercialization
-
1.2 Program: Community Economic Growth
- 1.2.1 Sub-Program: Infrastructure Programming
- 1.2.2 Sub-Program: Community Development
- 1.2.3 Sub-Program: Community Futures Program
- 1.2.4 Sub-Program: Targeted Economic Initiatives
-
1.3 Program: Policy, Advocacy and Coordination
- 1.3.1 Sub-Program: Advocacy and Coordination
- 1.3.2 Sub-Program: Economic Analysis
- Internal Services
Organizational Priorities
In 2014–15, WD focused on the seven organizational priorities below as outlined in the 2014–15 Report on Plans and Priorities.ii These key areas provide greater clarity and focus for the Department on creating jobs and promoting economic growth while delivering on its mandate to develop and diversify the western Canadian economy.
| Priority | Typeiii | Program(s) |
|---|---|---|
|
Innovation |
Ongoing |
Business Development and Innovation Policy, Advocacy and Coordination |
|
Summary of Progress |
||
|
||
| Priority | Type | Program(s) |
|---|---|---|
| Skills Development and Training | New | Business Development and Innovation Community Economic Growth Policy, Advocacy and Coordination |
| Summary of Progress | ||
|
||
| Priority | Type | Program(s) |
|---|---|---|
|
Aboriginal Economic Growth |
New |
Business Development and Innovation Community Economic Growth Policy, Advocacy and Coordination |
| Summary of Progress | ||
|
||
| Priority | Type | Program(s) |
|---|---|---|
|
Trade and Investment |
Ongoing |
Business Development and Innovation Policy, Advocacy and Coordination |
| Summary of Progress | ||
|
||
| Priority | Type | Program(s) |
|---|---|---|
|
Revitalization of the Western Canada Business Services Network (WCBSN) |
New |
Business Development and Innovation Community Economic Growth |
| Summary of Progress | ||
|
||
| Priority | Type | Program(s) |
|---|---|---|
| Federal Defence Procurement | New |
Policy, Advocacy and Coordination Business Development and Innovation |
| Summary of Progress | ||
|
||
| Priority | Type | Program(s) |
|
Managing for Excellence in a Changing Environment |
Previously Committed to |
All programs |
| Summary of Progress | ||
|
||
Risk Analysis
| Risk | Risk Response Strategy | Link to Program Alignment Architecture |
|---|---|---|
|
Weak competitiveness and low productivity in Western Canada |
|
Business Development and Innovation |
|
Small domestic market and increasing global competition for western Canadian businesses |
|
Business Development and Innovation |
Western Canada is a significant contributor to the overall Canadian economy, accounting for 38 percent of Canada's real economic output in 2014. Western Canada's economic growth of 3.2 percent in 2014 outpaced the national average of 2.4 percent. Economic growth and prosperity in Western Canada continues to be largely resource-driven and the West has benefitted from prolonged periods of high demand and prices for commodities. Towards the end of the year, however, parts of the western Canadian economy lost momentum, as the impact of significantly lower oil prices started to dampen activity. Weaknesses in other commodity prices such as natural gas, coal, copper and potash have also contributed to the slowdown. While the West's natural resources provide a strong foundation for future economic growth, the resource-driven growth has masked a number of fundamental challenges facing Western Canada's long-term economic prospects.
Compared to their international competitors, businesses in Western Canada suffer from weak competitiveness and low productivity, due in part to comparatively low levels of investment in research and development and slower rates of adoption of new technologies and equipment. This is partly due to low levels of risk capital financing observed in Western Canada. Innovative start-up firms in the West face greater challenges in accessing sufficient financing for technology commercialization priorities; this funding gap is particularly pronounced for early-stage firms. In 2014–15, WD invested in projects and activities that helped businesses increase their productivity and competitiveness through the development, commercialization and adoption of new technologies and business processes.
Western Canadian businesses also face the challenge of a small domestic market and increasing global competition. Expanding trade and market opportunities for western Canadian businesses is an important component of economic prosperity. In order to remain competitive in a global economy, western Canadian businesses will need to increase their presence in international markets, participate in global value chains and attract foreign direct investment. Enhancement of transportation infrastructure will help improve the efficiency and competitiveness of western Canadian SMEs in foreign markets. In 2014–15, WD worked with western Canadian SMEs, industry associations and research institutions to improve access to global value chains, strengthen international partnerships and encourage foreign direct investment, in order to enhance access to international markets for western Canadian products and services.
Actual Expenditures
| 2014–15 Main Estimates |
2014–15 Planned Spending |
2014–15 Total Authorities Available for Use |
2014–15 Actual Spending (authorities used) |
Difference (actual minus planned) |
|---|---|---|---|---|
| 158,907,952 | 158,907,952 | 165,587,501 | 162,002,536 | 3,094,584 |
| 2014–15 Planned |
2014–15 Actual |
2014–15 Difference (actual minus planned) |
|---|---|---|
| 310 | 295 | (15) |
| Strategic Outcome(s), Program(s) and Internal Services | 2014-15 Main Estimates |
2014-15 Planned Spending |
2015-16 Planned Spending |
2016-17 Planned Spending |
2014-15 Total Authorities Available for Use |
2014-15 Actual Spending (authorities used) |
2013-14 Actual Spending (authorities used) |
2012-13 Actual Spending (authorities used) |
|---|---|---|---|---|---|---|---|---|
| Strategic Outcome: A growing and diversified western Canadian economy | ||||||||
| Business Development and Innovation | 100,598,774 | 100,598,774 | 100,520,050 | 98,374,079 | 105,778,090 | 107,678,368 | 98,912,661 | 117,571,416 |
| Community Economic Growth | 34,432,043 | 34,432,043 | 34,862,792 | 33,393,025 | 34,735,060 | 31,958,193 | 62,155,737 | 35,377,579 |
| Policy, Advocacy and Coordination | 10,741,002 | 10,741,002 | 10,145,094 | 10,898,859 | 11,153,518 | 8,736,194 | 9,306,314 | 8,538,591 |
| Strategic Outcome Subtotal | 145,771,819 | 145,771,819 | 145,527,936 | 142,665,963 | 151,666,668 | 148,372,755 | 170,374,712 | 161,487,586 |
| Internal Services Subtotal |
13,136,133 | 13,136,133 | 14,385,978 | 12,732,588 | 13,920,833 | 13,629,781 | 17,953,579 | 22,230,897 |
| Total | 158,907,952 | 158,907,952 | 159,913,914 | 155,398,551 | 165,587,501 | 162,002,536 | 188,328,291 | 183,718,483 |
Planned spending of $158.9 million for 2014–15 was increased by $6.7 million provided through new authorities and transfers, including $2.4 million from collections of repayable contributions, $2.0 million for a transfer from Agriculture and Agri-Food Canada (AAFC) related to the Canadian Beef Centre of Excellence, $2.0 million for an operating budget carry forward, and $0.3 million for various other minor adjustments.
Actual spending of $162.0 million exceeds planned spending by $3.1 million. This variance is primarily due to frozen allotments related to personnel, other government initiatives and Federal Council.
Actual FTE utilization is lower than planned as a result of a departmental strategy to review and streamline functions to improve efficiencies for future years. Results were achieved sooner than planned.
Alignment of Spending with Whole-of-Government Framework
| Strategic Outcome | Program | Spending Area | Government of Canada Outcome | 2014-15 Actual Spending |
|---|---|---|---|---|
| 1. A growing and diversified western Canadian economy | 1.1 Business Development and Innovation | Economic Affairs | Strong economic growth | 107,678,368 |
| 1.2 Community Economic Growth | Economic Affairs | Strong economic growth | 31,958,193 | |
| 1.3 Policy, Advocacy and Coordination | Economic Affairs | Strong economic growth | 8,736,194 |
| Spending Area | Total Planned Spending | Total Actual Spending |
|---|---|---|
| Economic Affairs | 145,771,819 | 148,372,755 |
| Social Affairs | 0 | 0 |
| International Affairs | 0 | 0 |
| Government Affairs | 0 | 0 |
Departmental Spending Trend
The figures presented in the chart below reflect the impact that sunset funding has had on the department's overall spending, representing approximately 14 percent and 13 percent in spending in 2013–14 and 2012–13. The majority of sunset funding is due to the cessation of the Community Infrastructure Improvement Fund (CIIF) initiative. Planned spending reduces in 2015–16 as a result of decreased program funding and stabilizes in 2016–17 onwards.
In addition, the figures presented in the chart below do not include funds spent through Other Government Department suspense accounts, on behalf of other departments. For example, in fiscal year 2014–15, WD expended approximately $25.6 million on behalf of Infrastructure Canada, under the Building Canada Fund and the Canada Strategic Infrastructure Fund.
Departmental Spending Trend Graph

Expenditures by Vote
For information on WD's organizational voted and statutory expenditures, consult the Public Accounts of Canada 2015,vi which is available on the Public Works and Government Services Canada website.vii
Section II: Analysis of Programs by Strategic Outcome
Strategic Outcome: A growing and diversified western Canadian economy
Western Economic Diversification Canada (WD) works to develop and diversify the western Canadian economy, helping to build businesses that are innovative and competitive, while diversifying the base of the western Canadian economy beyond primary resource industries.
WD's strategic outcome is advanced through the following programs:
- Business Development and Innovation: Western Canadian small and medium-sized enterprises (SME) are engaged in international business and are competitive and innovative;
- Community Economic Growth: Western Canadian communities have strong businesses, the capacity for socio-economic development and the necessary public infrastructure to support economic growth;
- Policy, Advocacy and Coordination: Policies and programs that strengthen the western Canadian economy; and
- Internal Services: Effective and efficient support for advancing the department's strategic outcome.
WD sets targets annually for all performance indicators at the program and sub-program level in the departmental Performance Measurement Framework (PMF). Progress is tracked against targets based primarily upon results that Grants and Contributions projects report during the fiscal year. In addition, WD collects information on several non-PMF performance indicators to support accountability and programming decision-making.
WD also utilizes a number of economic indicators to gauge the competitiveness, growth and diversity of the western Canadian economy. The chart below outlines Western Canada's performance across four economic indicators over the past five years. As a benchmark, Canada's performance in these indicators is included.
The results show strong economic growth in Western Canada for a fifth consecutive year following the downturn in 2009. Over the past five years, growth in Western Canada's real Gross Domestic Product (GDP) exceeded that of Canada. In 2014, real GDP growth in Western Canada was 3.2 percent compared to 2.4 percent for Canada. Towards the end of the year, however, the western Canadian economy lost some momentum, as the impact of lower commodity prices started to dampen economic activity. It is expected that lower commodity prices will continue to be an economic drag on the western economy in the coming year.
| Performance Indicatorsviii | 2010 | 2011 | 2012 | 2013 | 2014 (Preliminary) | |
|---|---|---|---|---|---|---|
| Real GDP growth | Canada | 3.4% | 3.0% | 2.0% | 2.1% | 2.4% |
| West | 4.0% | 4.4% | 3.4% | 3.3% | 3.2% | |
| Labour productivity growth (change in real GDP per hour worked) | Canada | 1.6% | 1.6% | 0.4% | 1.2% | Data not available |
| West | 2.6% | 2.3% | 0.3% | 1.9% | ||
| Primary production as a percentage of GDP | Canada | 9.5% | 9.7% | 9.6% | 9.9% | 10.1% |
| West | 19.7% | 19.8% | 19.7% | 20.0% | 20.3% | |
| Gross Domestic Expenditures on Research and Development (R&D) as percentage of GDP | Canada | 1.8% | 1.8% | 1.7% | 1.6% | Data not available |
| West | 1.2% | 1.2% | 1.1% | Data not yet available | ||
Despite the economic strength of Western Canada, challenges remain with respect to Gross Domestic Expenditures on R&D as a percentage of GDP which are consistently lower in Western Canada when compared to that of Canada. In 2014, primary production as a percentage of GDP was 20.3 percent in Western Canada as compared to 10.1 percent for Canada owing to the predominance of the natural resources sector in the western provinces. The region's challenge relating to R&D expenses as a percentage of GDP may be in part due to Western Canada's traditional strengths in primary production which have been less R&D intensive than, for example, manufacturing.
Program 1.1: Business Development and Innovation
Description
Business Development and Innovation supports western Canadian businesses and industry organizations to enhance global trade and investment, business growth and competitiveness, and innovation and technology commercialization. Transfer payments in support of this program are made under the authority of the Women's Enterprise Initiative (WEI) and the Western Diversification Program (WDP).
| 2014-15 Main Estimates |
2014-15 Planned Spending |
2014-15 Total Authorities Available for Use |
2014-15 Actual Spending (authorities used) |
2014-15 Difference (actual minus planned) |
|---|---|---|---|---|
| 100,598,774 | 100,598,774 | 105,778,090 | 107,678,368 | 7,079,594 |
Note: Actual spending is higher than planned due to more project approvals under Business Development and Innovation following comparative analysis of all proposals received.
| 2014–15 Planned |
2014–15 Actual |
2014–15 Difference (actual minus planned) |
|---|---|---|
| 113 | 107 | (6) |
| Expected Result | Performance Indicators | Targets | Actual Results |
|---|---|---|---|
| Western Canadian SMEs are engaged in international business | Value of international business activity facilitated by WD | $41 million | $72.8 million |
| Western Canadian SMEs are competitive | Number of SMEs that increase gross margins | 8 | 25 |
| Western Canadian SMEs are innovative | Number of instances of protection of intellectual property exercised | 10 | 24 |
Performance Analysis and Lessons Learned
WD tracks three indicators to capture the impact of the Business Development and Innovation program: value of international business activity facilitated by WD; number of SMEs that increase gross margins; and number of instances of protection of intellectual property exercised.
WD met or exceeded its targets for all three performance indicators related to the Business Development and Innovation program (see Performance Results table above). The variance can be attributed to WD's projects being multi-year in nature with results sometimes reported earlier than anticipated. In addition, as these indicators were introduced by WD for the first time in 2013–14, trends analysis could not be applied to setting the targets for 2014–15.
In 2014–15, WD introduced a Call for Proposalsix (CFP) for not-for-profit applicants seeking support through the WDP and carried out two intakes in May 2014 and February 2015. WD followed a comparative assessment process to review applications received from clients. The Department has found that this new approach strengthens its ability to be strategic, to better communicate the department's priorities to western stakeholders, as well as to more effectively target its investments towards WD's strategic priorities.
In addition to WD's ongoing support for innovation through the WDP, the Western Innovationx (WINN) Initiative was launched in 2013–14 to assist SMEs in commercializing new innovative products, processes and services. Based on a competitive assessment process, under the first WINN intake, WD approved 30 projects, totalling $28.1 million. The process was successful in attracting high-quality applications, and only minor changes were made to the program design and outreach strategy ahead of the second intake, which opened in September 2014.
Sub-program 1.1.1: Trade, Investment and Market Access
Description
Trade, Investment and Market Access focuses on increasing Western Canada's participation in global markets, increasing awareness of Western Canada's technology capabilities abroad and attracting new foreign investment to support access to and participation in global value chains. It strives to strengthen trade-related infrastructure to enhance trade flows in and out of Western Canada and promotes Western Canada as an attractive destination for international tourists, students, researchers and investors. Transfer payments in support of this sub-program are made under the authority of the Western Diversification Program.
| 2014-15 Planned Spending |
2014-15 Actual Spending |
2014-15 Difference (actual minus planned) |
|---|---|---|
| 19,627,047 | 14,638,761 | (4,988,286) |
Note: Actual spending is lower than planned primarily due to more project approvals in other priority areas following comparative analysis of all proposals received.
| 2014–15 Planned |
2014–15 Actual |
2014–15 Difference (actual minus planned) |
|---|---|---|
| 34 | 28 | (6) |
| Expected Result | Performance Indicators | Targets | Actual Results |
|---|---|---|---|
| Capacity of western clients to pursue international business opportunities or attract international visitors | Number of western SMEs and other organizations pursuing a new trade, investment or international research and development opportunities, as a result of global advisory services | 250 | 346 |
| Capacity to support the flow of goods and services in/out of Western Canada | Value of improvements to trade infrastructure | $1 million | $0 |
| International awareness of trade, investment and tourism opportunities, and SME technology capabilities in Western Canada | Value of international business leads generated through missions/events | $57 million | $60.4 million |
Performance Analysis and Lessons Learned
WD tracks three indicators to capture the impact of the Trade, Investment and Market Access sub-program: number of western SMEs and other organizations pursuing a new trade, investment or international research and development opportunities, as a result of global advisory services; value of improvements to trade infrastructure; and value of international business leads generated through missions/events.
WD met or exceeded its targets for two of the three performance indicators related to the Trade, Investment and Market Access sub-program (see Performance Results table above). The positive variance for one of the indicators, number of western SMEs and other organizations pursuing new trade, investment or international research and development opportunities as a result of global advisory services, is due to four projects reporting results earlier than forecasted. The negative variance for one of the indicators, value of improvements to trade infrastructure, is due to a project that was included in the target setting exercise but was not approved; there was only one other project related to this indicator which had not forecasted any results for 2014–15.
In 2014–15, WD approved $18.6M in funding for 17 Trade and Investment projects out of $46.2M in total project costs. The projects approved responded to all three Trade and Investment priorities, including increasing the capacity of western SMEs to enter international markets, enhancing western trade corridors, and raising the international awareness of western Canadian goods, services and technologies. All of the projects aligned with the Government of Canada's Global Markets Action Plan.xi For the second WDP intake, the Department refined its parameters, providing more concrete examples of its support for Trade and Investment to enhance clarity and understanding of its objectives and to strengthen communication with western stakeholders.
Sub-program 1.1.2: Business Productivity and Growth
Description
Business Productivity and Growth supports western Canadian businesses, business service providers and industry to undertake initiatives to enhance business productivity, competitiveness and growth of western Canadian SMEs. In addition, this sub-program supports delivery of business services and access to capital for targeted client groups such as women, persons with disabilities and Aboriginal people through partner organizations. Transfer payments in support of this sub-program are made under the authority of the Women's Enterprise Initiative and the Western Diversification Program.
| 2014-15 Planned Spending |
2014-15 Actual Spending |
2014-15 Difference (actual minus planned) |
|---|---|---|
| 24,002,214 | 34,154,560 | 10,152,346 |
Note: Actual spending is higher than planned primarily as a result of more project approvals than anticipated under this sub-program following comparative analysis of all proposals received.
| 2014–15 Planned |
2014–15 Actual |
2014–15 Difference (actual minus planned) |
|---|---|---|
| 28 | 29 | 1 |
| Expected Result | Performance Indicators | Targets | Actual Results |
|---|---|---|---|
| Access to business development services, capital and leveraged capital | Number of businesses created, maintained or expanded through business or capital services | 2,800 | 2,469 |
| Adoption of sound management and business practices, and technology | Number of SMEs investing in adoption of sound management or business practices, or technology | 270 | 1,525 |
| Access to skilled labour | Number of skilled workers hired as a result of training, or skills certification | 240 | 153 |
Performance Analysis and Lessons Learned
WD tracks three indicators to capture the impact of the Business Productivity and Growth sub-program: number of businesses created, maintained or expanded through business or capital services; number of SMEs investing in adoption of sound management or business practices, or technology; and number of skilled workers hired as a result of training or skills certification.
WD met or exceeded its targets for one of the three performance indicators related to the Business Productivity and Growth sub-program (see Performance Results table above). Two of the three business productivity indicators ("Number of SMEs investing in adoption of sound management or business practices, or technology," and "Number of skilled workers hired as a result of training, or skills certification") were introduced by WD for the first time in 2013-14. The variance between the actual results and the targets for these two new indicators is attributed to the lack of trends data during the target setting exercise.
In 2014–15, WD approved $17.2 million in funding for 17 Business Productivity and Growth projects. WD targeted investments in skills development and training initiatives that increased the availability of equipment and implemented on-site training programs and partnerships between industry and organizations that deliver post-secondary training to increase the training capacity. In addition, WD continued its efforts to revitalize the Western Canada Business Service Network[xii] (WCBSN). The Department focused its efforts in 2014-15 on the Community Futures[xiii] (CFs) and WEI organizations,[xiv] and by the end of the year, had completed this work to enhance the governance, accountability, performance and alignment of the CFs and WEIs. This work will shift to other WCBSN members, including the Francophone Economic Development Organizations (FEDOs),[xv] Aboriginal Business Services Network, Entrepreneurs with Disability program and Canada Business Network in 2015-16.
Sub-program 1.1.3: Innovation Capacity Building
Description
Innovation Capacity Building strengthens the innovation system in the West by supporting efforts of research and not-for-profit institutions to commercialize knowledge-based products, processes and services. It also supports relevant skills training for highly qualified personnel. Transfer payments in support of this sub-program are made under the authority of the Western Diversification Program.
| 2014-15 Planned Spending |
2014-15 Actual Spending |
2014-15 Difference (actual minus planned) |
|---|---|---|
| 11,440,941 | 22,869,242 | 11,428,301 |
Note: Actual spending is higher than planned primarily due to more project approvals than anticipated under this sub-program following comparative analysis of all proposals received.
| 2014–15 Planned |
2014–15 Actual |
2014–15 Difference (actual minus planned) |
|---|---|---|
| 9 | 9 | 0 |
| Expected Result | Performance Indicators | Targets | Actual Results |
|---|---|---|---|
| Initial Technology Development - basic technological components are integrated for testing and validation in a simulated (laboratory) environment | Value of applied research and development undertaken up to three years after the funding period | $10 million | $2.9 million |
| Intermediate Technology Development - prototypes are ready for demonstration in an operational setting | Number of prototypes ready for demonstration in operational environment | 70 | 1,874 |
| Highly Qualified People (HQP) - create a pool of HQP to support the commercialization of knowledge-based products, processes and services | Number of HQP trained | 500 | 396 |
Performance Analysis and Lessons Learned
WD tracks three indicators to capture the impact of the Innovation Capacity Building sub-program: value of applied research and development undertaken up to three years after the funding period; number of prototypes ready for demonstration in operational environment; and number of HQP trained.
WD exceeded its target for one of the three performance indicators related to the Innovation Capacity Building sub-program (see Performance Results table above). The result for the value of applied research and development undertaken was below target owing to a number of projects that were still completing installation of the requisite equipment at the end of the reporting period. These projects are expected to deliver results in line with targets in subsequent reporting periods. The result for number of prototypes ready for demonstration substantially exceeded the target because of a number of recipients leveraging WD's investments to attract additional partners, which allowed for an expanded scope of services. The result for number of HQP trained was slightly below target because WD's projects tend to be multi-year in nature and results are sometimes realised or reported later than anticipated.
In addition to funding projects supporting Innovation Capacity Building, WD also convened events and spearheaded initiatives that brought together key western stakeholders from industry, post-secondary institutions, major research facilities and government to discuss innovation policy, strengthen the innovation marketplace and support commercial opportunities. Examples of such initiatives include an Energy Innovation Roundtable in Calgary in conjunction with Natural Resources Canada, and regular and ad-hoc meetings with the National Research Council-Industrial Research Assistance Program, the BC Innovation Council, Alberta Innovates Technology Futures, Innovation Saskatchewan, Canadian Lightsource, Sustainable Development Technology Canada, Canada Foundation for Innovation, the major western universities, western provincial ministries, and other federal departments with mandates to support innovation, among others.
Sub-program 1.1.4: Technology Commercialization
Description
Technology Commercialization supports SMEs, directly or indirectly through not-for-profit entities, in the development and production of prototypes, demonstration of products and third party certification, as well as testing and quality assurance of specific products. In addition, it supports outreach and promotional activities to attract investment, validate market potential and end user acceptance, and facilitate market-ready knowledge-based products, processes and services. Transfer payments in support of this sub-program are made under the authority of the Western Diversification Program.
| 2014-15 Planned Spending |
2014-15 Actual Spending |
2014-15 Difference (actual minus planned) |
|---|---|---|
| 45,528,572 | 36,015,805 | (9,512,767) |
Note: Actual spending is lower than planned primarily due to more project approvals in other priority areas following comparative analysis of all proposals received.
| 2014–15 Planned |
2014–15 Actual |
2014–15 Difference (actual minus planned) |
|---|---|---|
| 42 | 41 | (1) |
| Expected Result | Performance Indicators | Targets | Actual Results |
|---|---|---|---|
| Advanced Technology Development - the technology in its final form is proven through successful deployment in an operational setting under real-life conditions | Number of products, processes or services proven through successful deployment in an operational setting | 6 | 20 |
| Enhanced financial capacity of SMEs to pursue technology development and commercialization | Value of incremental private sector investment attracted | $0* | $3 million |
| Sales of knowledge-based products, processes and/or services by SMEs | Value of sales tied to the knowledge-based product/ process/ service/ technology commercialized | $0* | $18.6 million |
* Although WD began investing in Technology Commercialization activities through the WINN Initiative in 2014–15, these types of activities have historically required more than one year to demonstrate results. Therefore, this target was set to zero for 2014–15.
Performance Analysis and Lessons Learned
WD tracks three indicators to capture the impact of the Technology Commercialization sub-program: number of products, processes or services proven through successful deployment in an operational setting; value of incremental private sector investment attracted; and value of sales tied to the knowledge-based product/ process/ service/ technology commercialized.
WD met or exceeded its targets for all three performance indicators related to the Technology Commercialization sub-program (see Performance Results table above). For all three indicators, the higher than expected results stem from projects achieving results earlier than anticipated.
WD successfully launched the new WINN Initiativexvi in 2013–14, and 2014–15 saw 30 projects approved for a total of $28.1 million in WD support. This funding will assist for-profit SMEs in Western Canada to bring new technology-based products, processes and services to market. In addition, WD contributed to 23 new projects under the Western Diversification Program (WDP) in 2014–15 in support of this priority area, totaling $41.5 million. Generally, these types of activities require a few years to demonstrate results.
In addition to funding technology commercialization projects, the Department engaged innovation stakeholders and partners around ways to advance technology commercialization activities in Western Canada. For example, WD convened public investors in conjunction with the Propel Energy Tech Forum held in Calgary in January 2015 as well as an investor roundtable in conjunction with the Canadian Financing Forum held in Vancouver in February 2015. WD officials have also pursued discussions separately with Sustainable Development Technology Canada (SDTC), Canada Foundation for Innovation (CFI), and Natural Research Council officials in a structured engagement aimed at establishing collaborative arrangements that support western Canada's innovation eco-system and technology commercialization. In addition, WD officials met with Polytechnics Canada in November 2014 to discuss WD programs as they relate to the group's research and commercialization interests.
Program 1.2: Community Economic Growth
Description
Community Economic Growth involves economic development initiatives that support communities to advance their economies, adjust to changing and challenging economic circumstances and recover from depressed economic circumstances. This is achieved through both funding of projects to support infrastructure programming and community development, as well as funding support of the Community Futures (CF) organizations. Transfer payments in support of this program are made under the authority of the Western Diversification Program and the Community Futures Program.
| 2014-15 Main Estimates |
2014-15 Planned Spending |
2014-15 Total Authorities Available for Use |
2014-15 Actual Spending (authorities used) |
2014-15 Difference (actual minus planned) |
|---|---|---|---|---|
| 34,432,043 | 34,432,043 | 34,735,060 | 31,958,193 | (2,473,850) |
| 2014–15 Planned |
2014–15 Actual |
2014–15 Difference (actual minus planned) |
|---|---|---|
| 34 | 35 | 1 |
| Expected Result | Performance Indicators | Targets | Actual Results |
|---|---|---|---|
|
Western Canadian communities have strong businesses |
SME sales growthxvii |
13.0% | 10.2% |
|
Western Canadian communities have capacity for socio-economic development |
Number of communities benefitting from Community Economic Growth projects |
1,400 | 1,338 |
|
Western Canadian communities have the necessary public infrastructure to support economic growth |
Number of communities benefitting from federal public infrastructure investments |
n/a* | n/a |
* With the cessation of the Community Infrastructure Improvement Fund (CIIF) in March 2014, WD did not anticipate results related to this indicator for 2014–15. The results of WD's work to support community infrastructure through programs delivered on behalf of Infrastructure Canada are reported through Infrastructure Canada.
Performance Analysis and Lessons Learned
WD tracks three indicators to capture the impact of the Community Economic Growth program: SME sales growth; number of communities benefitting from Community Economic Growth projects; and number of communities benefitting from federal public infrastructure investments.
WD achieved actual results of almost 80 percent or more against targets set for two indicators related to the Community Economic Growth program (see Performance Results table above). The variance in the SME sales growth indicator is due to the economic slowdown in 2008–09 as the results are based on Statistics Canada data for the five year period between 2007 and 2012. xviii
WD continues to engage in activities to achieve greater impact from its investments in western Canadian communities. In 2014–15, WD increased its engagement and outreach with Aboriginal communities. Of particular note, WD became a member of the new Strategic Partnerships Initiative (SPI) West Coast Energy Committee, an interdepartmental governance structure established to support decision-making on SPI West Coast energy development. A total of six early stage economic development projects, which would not normally be funded by WD, were approved for WD delivery through this initiative.
WD continues to participate in the Economic Development Initiative (EDI),xix under the Government of Canada's strategy for official languages Roadmap for Canada's Official Languages (2013–2018): Education, Immigration, Communitiesxx by supporting economic development in official language minority communities (OLMCs) across Western Canada. The initiative facilitates sustainable growth in OLMCs by promoting the development of new expertise through innovation, diversification, partnerships and increased support for communities and SMEs.
Sub-program 1.2.1: Infrastructure Programming
Description
Infrastructure Programming provides community funding in Western Canada to build and renew infrastructure in rural and urban municipalities across Canada, allowing them to compete in the regional, national and global economy. WD delivers infrastructure programming directly or in partnership with other federal departments and the four western provincial governments. Transfer payments in support of direct delivery of this sub-program are made through designated program authorities, excluding the Western Diversification Program. Transfer payments in support of the delivery of this sub-program are made through Other Government Department Suspense accounts when WD delivers programs on behalf of other federal departments.
| 2014-15 Planned Spending |
2014-15 Actual Spending |
2014-15 Difference (actual minus planned) |
|---|---|---|
| 1,047,054 | 955,735 | (91,319) |
Note: In 2014–15, WD continued to process claims, monitor and follow-up on contributions made under the Community Infrastructure Improvement Fund (CIIF) and Building Canada Fund (BCF).
| 2014–15 Planned |
2014–15 Actual |
2014–15 Difference (actual minus planned) |
|---|---|---|
| 11 | 9 | (2) |
| Expected Result | Performance Indicators | Targets | Actual Results |
|---|---|---|---|
| New or improved environmental infrastructure | Number of new or improved environmental systems | n/a* | n/a |
| New or improved transportation or telecommunications infrastructure | Number of new or improved transportation or telecommunications networks | n/a* | n/a |
| New or improved community, cultural, recreational, tourism or other related infrastructure | Number of new or improved community, cultural, recreational, tourism or other related facilities | n/a* | n/a |
* With the cessation of the CIIF in March 2014, WD did not anticipate results related to this indicator for 2014–15. The results of WD's work to support community infrastructure through programs delivered on behalf of Infrastructure Canada are reported through Infrastructure Canada.
Performance Analysis and Lessons Learned
Not applicable (see notes above).
Sub-program 1.2.2: Community Development
Description
Community Development assists communities, including the OLMCs, to assess community needs and develop community strategic plans in response to those needs. It also provides funding for the implementation of projects that stimulate economic development and capitalize on communities' capacity, strengths and opportunities. Transfer payments in support of this sub-program are made under the authority of the Western Diversification Program.
| 2014-15 Planned Spending |
2014-15 Actual Spending |
2014-15 Difference (actual minus planned) |
|---|---|---|
| 3,189,378 | 2,325,176 | (864,202) |
Note: Actual spending is lower than planned primarily due to more project approvals in other priority areas following comparative analysis of all proposals received.
| 2014–15 Planned |
2014–15 Actual |
2014–15 Difference (actual minus planned) |
|---|---|---|
| 9 | 6 | (3) |
| Expected Result | Performance Indicators | Targets | Actual Results |
|---|---|---|---|
| Strong community strategic planning | Number of local and regionally-based community strategic plan(s) developed and/or updated | 100 | 32 |
| Effective implementation of community plans | Value of community-based projects | $12 million | $6.7 million |
Performance Analysis and Lessons Learned
WD tracks two indicators to capture the impact of the Community Development sub-program: number of local and regionally-based community strategic plan(s) developed and/or updated; and value of community-based projects.
WD did not meet its targets related to the Community Development sub-program because the performance indicators are new, first introduced by WD in 2013–14, resulting in a lack of historic trend data during the target setting exercise (see Performance Results table on above).
In 2014–15, WD primarily implemented this sub-program through its support to the Francophone Economic Development Organisation (FEDO) in each western province. Examples of 2014–15 initiatives include:
- In British Columbia, the FEDO Société de développement économique de la Colombie-Britannique was involved when Air France established service between Vancouver International Airport and Paris Charles de Gaulle Airport in March 2015;
- In Alberta, the FEDO Conseil de développement économique de l'Alberta organized a trade mission of francophone entrepreneurs and business representatives to the Northwest Territories (NWT) in collaboration with the NWT Economic Development Council and with financial support from the Canadian Northern Economic Development Agency;
- In Manitoba, the FEDO Conseil de développement économique des municipalités bilingues du Manitoba organised a Lion's Den small business competition which helped launch the Voilà fashion collection; and
- In Saskatchewan, the FEDO Conseil de la coopération de la Saskatchewan, through the "Bienvenue Signage Program" project promoted French services across Saskatchewan.
Sub-program 1.2.3: Community Futures Program
Description
The CF Program[xxi] builds the capacity of rural communities to increase their economic activities by aiding the development and implementation of local solutions to local problems. This sub-program provides financial support to CF organizations to deliver a range of small business services, provide repayable financing to new and existing enterprises, and support development of strategic plans and community economic development projects to address community needs. Transfer payments in support of this sub-program are made under the authority of the CF Program.
| 2014-15 Planned Spending |
2014-15 Actual Spending |
2014-15 Difference (actual minus planned) |
|---|---|---|
| 30,011,440 | 28,665,500 | (1,345,940) |
| 2014–15 Planned |
2014–15 Actual |
2014–15 Difference (actual minus planned) |
|---|---|---|
| 13 | 20 | 7 |
Note: Actual FTE utilization is higher than planned as a result of increased activities in support of CF Revitalization activities.
| Expected Result | Performance Indicators | Targets | Actual Results |
|---|---|---|---|
| Strong rural community strategic planning and implementation | Value of community-based projects | $13 million | $24 million |
| Rural access to business development services | Number of businesses created, maintained or expanded through business services | 940 | 1,460 |
| Rural access to capital and leveraged capital | Value of loans | $62 million | $77.5 million |
Performance Analysis and Lessons Learned
WD tracks three indicators to capture the impact of the Community Futures (CF) sub-program: value of community-based projects; number of businesses created, maintained or expanded through business services; and value of loans.
WD exceeded its targets for all three performance indicators related to the CF sub-program (see Performance Results table above). The significant over-achievement of the indicator on the value of community based projects is attributed to communities leveraging greater resources than anticipated in support of local projects. The variance in the number of businesses created, maintained or expanded through the businesses services indicator was due to a lower target based on prior year trends, resulting in the number of services being higher than anticipated. The high achievement of the indicator on rural access to capital, as measured by the value of loans, over $77 million, is an indication of the strong impact of CFs in rural communities across the West and reflects progress made as a result of CF Revitalization efforts.
Over the past year, WD has engaged in several activities to implement CF Revitalization decisions to enhance the effectiveness of the CF program. This has resulted in issuing new three-year Contribution Agreements to the vast majority of the western Canadian CFs. The intent is a revitalized CF network that continues to be focused on ensuring activities which maximize the economic impact of CF members in Western Canada and align with Government of Canada and WD priorities.
A 2014–15 analysis[xxii] of data submitted by CFs regarding their clients, compared to similarly sized and located companies contained in Statistics Canada's database, revealed strong performance by CFs in prior years:
- Employment Growth - In terms of employment, CF assisted firms grew at a compounded rate of 7.92 percent per year compared to 0.93 percent for non-assisted firms from 2007 to 2012.
- Sales Growth - In terms of sales, CF assisted firms grew at a compounded rate of 10.23 percent compared to 2.76 percent for non-assisted firms from 2007 to 2012.
- Firm Longevity - CF assisted firms exhibited stronger firm longevity than those firms in the comparable group, especially in the long run. There was a 71 percent survival rate after five years for CF assisted businesses versus 46 percent for non-assisted.
- Industry Diversification - CF organizations are lending to a slightly less diversified client base than the comparable group.
Sub-program 1.2.4: Targeted Economic Initiatives
Description
Targeted Economic Initiatives support economic activity in western Canadian communities on a temporary basis through targeted economic stimulus or adjustment. WD provides assistance through dedicated, temporary supplementary funding from the Government of Canada or through the department's own special allocations. Transfer payments in support of this sub-program are made through designated funding authorities and may be made under the authority of the Western Diversification Program as a temporary and targeted measure only.
| 2014-15 Planned Spending |
2014-15 Actual Spending |
2014-15 Difference (actual minus planned) |
|---|---|---|
| 184,171 | 11,782 | (172,389) |
Note: Actual spending is lower than planned due to efficiencies gained on repayable contributions as projects mature under the Community Adjustment Fund.
| 2014–15 Planned |
2014–15 Actual |
2014–15 Difference (actual minus planned) |
|---|---|---|
| 1 | 0 | (1) |
| Expected Result | Performance Indicators | Targets | Actual Results |
|---|---|---|---|
| Businesses opportunities are created | Number of businesses created, maintained or expanded | n/a* | n/a |
| Community opportunities are created | Value of community-based projects, as well as leverage | n/a* | n/a |
| Job opportunities are created | Number of jobs created, maintained or expanded | n/a* | n/a |
* No results for targeted economic initiatives were expected for 2014–15.
Performance Analysis and Lessons Learned
Not applicable (see note above).
Program 1.3: Policy, Advocacy and Coordination
Description
Policy, Advocacy and Coordination supports the advancement of the interests of Western Canada through effective strategies, policies and programs that address western economic development needs and by establishing cooperative relationships with key stakeholders. Transfer payments in support of this program are made under the authority of the Western Diversification Program.
| 2014-15 Main Estimates |
2014-15 Planned Spending |
2014-15 Total Authorities Available for Use |
2014-15 Actual Spending (authorities used) |
2014-15 Difference (actual minus planned) |
|---|---|---|---|---|
| 10,741,002 | 10,741,002 | 11,153,518 | 8,736,194 | (2,004,808) |
Note: Actual spending is lower than planned as a result of reallocation of funding to other departmental priorities.
| 2014–15 Planned |
2014–15 Actual |
2014–15 Difference (actual minus planned) |
|---|---|---|
| 64 | 58 | (6) |
| Expected Result | Performance Indicators | Targets | Actual Results |
|---|---|---|---|
| Policies that strengthen the western Canadian economy | Percentage of key informants with the opinion that WD activities resulted in policies that support the economic development of Western Canada | 90% | 82.7%[xxiii] |
| Programs that strengthen the western Canadian economy | Percentage of key informants with the opinion that WD activities resulted in programs that support the economic development of Western Canada | 90% | 87.0%[xxiv] |
Performance Analysis and Lessons Learned
WD continually refines and focuses its Policy, Advocacy and Coordination (PAC) program to meet the changing priorities of western Canadians. Through economic analysis, as well as engagement with key stakeholders, WD works to ensure that its priorities continue to be well aligned with specific needs of the business community in Western Canada. Results from the March 2014 PAC survey[xxv] sent to key stakeholders indicated that WD needs to enhance its communication efforts and better inform stakeholders of departmental activities and success stories.
WD has organized and convened several strategic events with key stakeholders in 2014–15. A significant example is the first Western Innovation Forum (WIF) which WD hosted in April 2014 in collaboration with Mitacs and the Canadian Association of Defence and Security Industries (CADSI) in Vancouver.[xxvi] This industry-oriented event with more than 500 participants connected Western Canada's aerospace, marine, defence and security industries with innovation-driven investment, partnership and business opportunities. The two day forum provided an opportunity for businesses, industry, government, researchers and suppliers to connect on opportunities and discuss key issues facing businesses and innovators in Western Canada. The event facilitated more than 140 Business-to-Business and Business-to-Government meetings. Benefits identified by businesses include the unique networking opportunities and making valuable business connections. Ninety eight percent of participants surveyed found the event met or exceeded expectations; 83 percent established new connections; and 49 percent identified prospective leads. Based on the success of the first forum, WD in collaboration with CADSI, Mitacs and the Canadian Commercial Corporation hosted a second WIF in April 2015.[xxvii]
Sub-program 1.3.1: Advocacy and Coordination
Description
Advocacy and Coordination advances Western Canada's interests in national policies, priorities, and programs through inclusion of regional issues and opportunities as identified by key stakeholders. Efforts in this sub-program lead to balanced, regionally sensitive approaches to Government of Canada priorities, coordinated economic development in the West and increased procurement opportunities in Western Canada. Transfer payments in support of this sub-program are made under the authority of the Western Diversification Program.
| 2014-15 Planned Spending |
2014-15 Actual Spending |
2014-15 Difference (actual minus planned) |
|---|---|---|
| 7,362,952 | 5,847,311 | (1,515,641) |
Note: Actual spending is lower than planned as a result of reallocation of funding to other departmental priorities.
| 2014–15 Planned |
2014–15 Actual |
2014–15 Difference (actual minus planned) |
|---|---|---|
| 50 | 46 | (4) |
| Expected Result | Performance Indicators | Targets | Actual Results |
|---|---|---|---|
| Access to economic opportunities for Western Canada | Number of initiatives WD engaged in to enhance access to economic development opportunities for Western Canada | 26 | 39 |
| Coordinated economic development activities, policies and programs in Western Canada | Number of economic development initiatives undertaken, programs implemented and policies developed which were coordinated by WD | 14 | 34 |
| Access to procurement opportunities for western Canadian SMEs | Number of initiatives WD engaged in to enhance access to procurement opportunities for western Canadian SMEs | 25 | 38 |
Performance Analysis and Lessons Learned
WD tracks three indicators to capture the impact of the Advocacy and Coordination sub-program: number of initiatives WD engaged in to enhance access to economic development opportunities for Western Canada; number of economic development initiatives undertaken, programs implemented and policies developed which were coordinated by WD; and number of initiatives WD engaged in to enhance access to procurement opportunities for western Canadian SMEs.
WD exceeded its targets for all three performance indicators related to the Advocacy and Coordination sub-program (see Performance Results table above). WD increased its engagement activities (e.g., roundtables, committees, workshops) to advance its strategic priorities, as well as meetings with stakeholders on the department's programs and to gather views on the western Canadian economy. The Department also increased its convening activities to help create connections between industry, post-secondary education institutions, other types of stakeholders and governments. The 2014 WIF is an example of a key initiative organized by WD to convene stakeholders.
In order to support coordinated economic development in Western Canada, WD convened two roundtables on access to capital financing in winter 2015, at the Propel Energy Technology Forum in Calgary and at the Canadian Financing Forum in Vancouver. The roundtables brought together stakeholders, representing both industry and government, to discuss the challenges associated with securing financing for innovative activity and helped to facilitate connections between government, business and the investment community. Participants welcomed the opportunity to meet and discuss the opportunities and challenges in ensuring that SMEs have access to the capital and resources they need to grow and expand.
In 2014, WD and Natural Resources Canada convened the Energy Innovation Roundtable in Calgary. The Roundtable brought together stakeholders representing government, industry and academia to discuss how they can better facilitate innovation in the energy sector, including how to better support SMEs. The event facilitated business and government engagement on key innovation opportunities in the energy sector.
In December 2014, WD, in partnership with Aboriginal Affairs and Northern Development Canada (AANDC) and Employment and Social Development Canada (ESDC), hosted the Saskatchewan Aboriginal Economic Development and Skills Forum in Saskatoon. The event provided a forum for networking, promoting Aboriginal economic development and skills training programs, and an opportunity for participants to attend business to funder meetings. More than 100 people attended the forum including representation from 45 Saskatchewan Aboriginal communities and economic development organizations. Future collaborations between AANDC, ESDC and WD are actively being pursued.
WD also signed a Memoranda of Understanding with the Canadian Commercial Corporation to enhance collaboration on export opportunities to foreign militaries.
Sub-program 1.3.2: Economic Analysis
Description
Economic Analysis increases understanding of western Canadian challenges, opportunities, and priorities through externally generated or in-house research. Economic analysis also supports internal as well as Government of Canada policy and program development. Transfer payments in support of this sub-program are made under the authority of the Western Diversification Program.
| 2014-15 Planned Spending |
2014-15 Actual Spending |
2014-15 Difference (actual minus planned) |
|---|---|---|
| 3,378,050 | 2,888,883 | (489,167) |
Note: Actual spending is lower than planned as a result of reallocation of funding to other departmental priorities.
| 2014–15 Planned |
2014–15 Actual |
2014–15 Difference (actual minus planned) |
|---|---|---|
| 14 | 12 | (2) |
| Expected Result | Performance Indicators | Targets | Actual Results |
|---|---|---|---|
| Decisions impacting the western Canadian economy are informed by evidence-based economic analysis | Number of evidence-based economic analyses conducted/ funded by WD | 31 | 47 |
Performance Analysis and Lessons Learned
WD tracks one indicator to capture the impact of the Economic Analysis sub-program: number of evidence-based economic analyses conducted or funded by WD.
WD exceeded its targets on the performance indicator related to the Economic Analysis sub-program (see Performance Results table above). The Department increased its internal economic analysis to inform departmental strategic directions, support project investment decisions and to inform departmental advocacy activities.
Economic analysis undertaken by WD in 2014–15 supported the department's advocacy and coordination work as well as its program delivery. For example, a comprehensive analysis of socio-economic indicators for Western Canada (State of the West) helped inform senior management of the regional strengths, opportunities and challenges related to Western Canada's economy and WD's priorities. Furthermore, the development of regional sector profiles supported the development of strategies for sector support with WD's priorities. Evidence–based analysis also supported stakeholder engagement. For instance, monthly reporting and analysis of issues relevant to economic development in Western Canada has been used to inform stakeholders of key issues, challenges and opportunities in Western Canada.
Internal Services
Description
Internal Services are groups of related activities and resources that are administered to support the needs of programs and other corporate obligations of the organization. These groups are Management and Oversight Services, Communications Services, Legal Services, Human Resources Management Services, Financial Management Services, Information Management Services, Information Technology Services, Real Property Services, Materiel Services, Acquisition Services and Other Administrative Services. Internal Services include only those activities and resources that apply across an organization and not to those provided to a specific program.
| 2014-15 Main Estimates |
2014-15 Planned Spending |
2014-15 Total Authorities Available for Use |
2014-15 Actual Spending (authorities used) |
2014-15 Difference (actual minus planned) |
|---|---|---|---|---|
| 13,136,133 | 13,136,133 | 13,920,833 | 13,629,781 | 493,648 |
| 2014–15 Planned |
2014–15 Actual |
2014–15 Difference (actual minus planned) |
|---|---|---|
| 99 | 95 | (4) |
Performance Analysis and Lessons Learned
WD undertook a number of initiatives to create a technology and systems-enabled workplace to contribute to the Government of Canada's Blueprint 2020[xxviii] goals of enhancing service delivery and value for money and to equip employees to work efficiently in a high-performance environment. For example, WD implemented Client Relationship Management (CRM) to support program delivery and identify potential projects aligned with WD and Government of Canada priorities. WD's CRM is being used to deliver the online application components of the WINN and WDP programs. It is also being used to deliver Access West, an electronic newsletter that reaches over 5,000 stakeholders.
Beginning in May 2014, WD moved to a CFP[xxix] process for not-for-profit proponents, which outlines WD's investment priorities using a fair, open and transparent business process. Once applications are received, the Department conducts a comparative analysis of proposals and makes investment decisions against a merit-based rating system. This approach strengthens WD's responsiveness to economic trends and industry needs and ensures alignment with Government of Canada plans and priorities.
To enhance client service, WD implemented a Life Cycle Project Management approach to managing a project from the time of first application for funding, through to the approval and payment stages, to the final time a proponent reports on the results of the project. Throughout the process, the objective is for the proponent to correspond with just one officer – from start to finish.
WD implemented GCDOCS, the new Government of Canada electronic documents and records management solution. This storage software enables WD to meet obligations for information lifecycle management and will help the Department to better manage projects and share information.
WD continues to invest in and expand the use of video-conferencing and web-based tools for participating and conducting inter-regional meetings and/or training sessions. This is an important consideration given WD's operations are in five geographic regions and its commitment to reduce travel expenses. WD also adopted the new government-wide Shared Travel System which has resulted in paperless travel activity and reporting. Furthermore, in Spring 2014, WD started providing tablet-style computers to staff which enabled greater flexibility in the workplace and will complement its strategy to reduce paper while streamlining business processes.
WD is a participant in the Federal Sustainable Development Strategy[xxx] (FSDS) and contributes to the Greening Government Operations targets through the Internal Services program. The Department contributes to the following target areas of Theme IV (Shrinking the Environmental Footprint–Beginning with Government) of the FSDS: e-waste, printing unit reduction, paper consumption, green meetings and green procurement. For additional details on WD's Departmental Sustainable Development Strategy, please see the List of Supplementary Information Tables in Section III.
Section III: Supplementary Information
Financial Statements Highlights
The financial highlights presented within this Departmental Performance Report are intended to serve as a general overview of Western Economic Diversification Canada's (WD) financial position and operations. The unaudited financial statements are prepared in accordance with accrual accounting principles (the link to complete financial statements is at the end of this section).
| Financial Information | 2014–15 Planned Results |
2014–15 Actual |
2013–14 Actual |
Difference (2014–15 actual minus 2014–15 planned) |
Difference (2014–15 actual minus 2013–14 actual) |
|---|---|---|---|---|---|
| Total expenses | 148,992,654 | 151,214,094 | 188,000,865 | 2,221,440 | (36,786,771) |
| Total revenues | 3,071 | 589 | 835 | (2,482) | (246) |
| Net cost of operations before government funding and transfers | 148,989,583 | 151,213,505 | 188,000,030 | 2,223,922 | (36,786,525) |
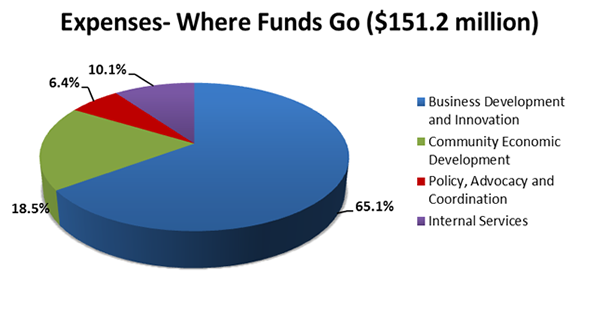
Total Expenses were $151.2 million in 2014–15, a decrease of $36.8 million (20 percent) over 2013–14. This year-over-year decrease is attributed to a reduction in transfer payment spending of $28.8 million, primarily due to the completion of the Community Infrastructure Improvement Fund and the Western Economic Partnership Agreements. The remaining $6.1 million is attributed to a reduction in operating expenses.
| Financial Information | 2014–15 | 2013–14 | Difference (2014–15 minus 2013–14) |
|---|---|---|---|
| Total net liabilities | 73,163,019 | 64,730,222 | 8,432,797 |
| Total net financial assets | 69,989,517 | 61,867,745 | 8,121,772 |
| Departmental net debt | (3,173,502) | (2,862,477) | (311,025) |
| Total non-financial assets | 228,463 | 467,452 | (238,989) |
| Departmental net financial position | (2,945,039) | (2,395,025) | (550,014) |
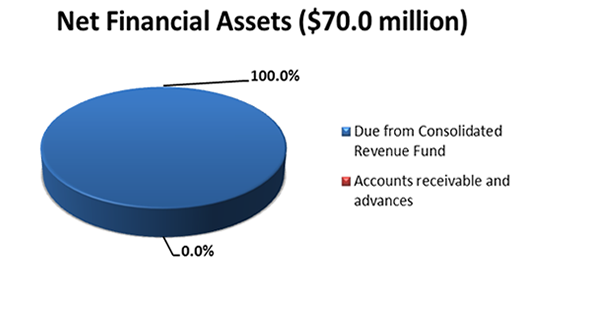
Net Financial Assets equaled $70.0 million at the end of 2014–15, an increase of $8.1 million (13 percent) over 2013–14. This increase is related to amounts Due from Consolidated Revenue Fund, which will be available to draw upon to pay for accounts payable established in 2014–15. The increase is attributed to additional accounts payable established for the Western Diversification Program (WDP) and Western Innovation Initiative (WINN).
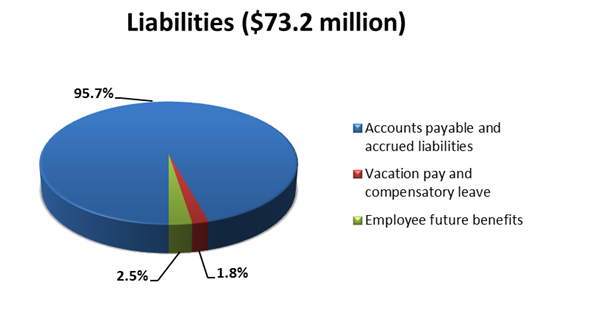
Total Liabilities were $73.2 million at the end of 2014–15, an increase of $8.4 million (13 percent) over 2013–14. This net increase is a result of the establishment of additional accounts payable for WDP and WINN.
Financial Statements
The complete WD financial statements can be found at www.wd-deo.gc.ca/eng/59.asp.
Supplementary Information Tables
The supplementary information tables listed in the 2014–15 Departmental Performance Report are available on the WD website.xxxi
- Departmental Sustainable Development Strategy;
- Details on Transfer Payment Programs of $5 Million or More;
- Internal Audits and Evaluations;
- Response to Parliamentary Committees and External Audits;
- Up-Front Multi-Year Funding; and
- User Fees Reporting.
Tax Expenditures and Evaluations
The tax system can be used to achieve public policy objectives through the application of special measures such as low tax rates, exemptions, deductions, deferrals and credits. The Department of Finance Canada publishes cost estimates and projections for these measures annually in the Tax Expenditures and Evaluations - external link xxxii publication. The tax measures presented in the Tax Expenditures and Evaluations publication are the responsibility of the Minister of Finance.
Section IV: Organizational Contact Information
Western Economic Diversification Canada
1500 Canada Place, 9700 Jasper Avenue Northwest
Edmonton, Alberta T5J 4H7
Canada
Telephone: 780-495-4164
Fax: 780-495-4557
Web: www.wd-deo.gc.ca
Appendix: Definitions
appropriation (crédit): Any authority of Parliament to pay money out of the Consolidated Revenue Fund.
budgetary expenditures (dépenses budgétaires): Includes operating and capital expenditures; transfer payments to other levels of government, organizations or individuals; and payments to Crown corporations.
Departmental Performance Report (rapport ministériel sur le rendement): Reports on an appropriated organization's actual accomplishments against the plans, priorities and expected results set out in the corresponding Report on Plans and Priorities. These reports are tabled in Parliament in the fall.
full-time equivalent (équivalent temps plein): Is a measure of the extent to which an employee represents a full person-year charge against a departmental budget. Full-time equivalents are calculated as a ratio of assigned hours of work to scheduled hours of work. Scheduled hours of work are set out in collective agreements.
Government of Canada outcomes (résultats du gouvernement du Canada): A set of 16 high-level objectives defined for the government as a whole, grouped in four spending areas: economic affairs, social affairs, international affairs and government affairs.
Management, Resources and Results Structure (Structure de la gestion, des ressources et des résultats): A comprehensive framework that consists of an organization's inventory of programs, resources, results, performance indicators and governance information. Programs and results are depicted in their hierarchical relationship to each other and to the Strategic Outcome(s) to which they contribute. The Management, Resources and Results Structure is developed from the Program Alignment Architecture.
non-budgetary expenditures (dépenses non budgétaires): Includes net outlays and receipts related to loans, investments and advances, which change the composition of the financial assets of the Government of Canada.
performance (rendement): What an organization did with its resources to achieve its results, how well those results compare to what the organization intended to achieve and how well lessons learned have been identified.
performance indicator (indicateur de rendement): A qualitative or quantitative means of measuring an output or outcome, with the intention of gauging the performance of an organization, program, policy or initiative respecting expected results.
performance reporting (production de rapports sur le rendement): The process of communicating evidence-based performance information. Performance reporting supports decision making, accountability and transparency.
planned spending (dépenses prévues): For Reports on Plans and Priorities (RPPs) and Departmental Performance Reports (DPRs), planned spending refers to those amounts that receive Treasury Board approval by February 1. Therefore, planned spending may include amounts incremental to planned expenditures presented in the Main Estimates.
A department is expected to be aware of the authorities that it has sought and received. The determination of planned spending is a departmental responsibility, and departments must be able to defend the expenditure and accrual numbers presented in their RPPs and DPRs.
plan (plan): The articulation of strategic choices, which provides information on how an organization intends to achieve its priorities and associated results. Generally a plan will explain the logic behind the strategies chosen and tend to focus on actions that lead up to the expected result.
priorities (priorité): Plans or projects that an organization has chosen to focus and report on during the planning period. Priorities represent the things that are most important or what must be done first to support the achievement of the desired Strategic Outcome(s).
program (programme): A group of related resource inputs and activities that are managed to meet specific needs and to achieve intended results and that are treated as a budgetary unit.
Program Alignment Architecture (architecture d'alignement des programmes): A structured inventory of an organization's programs depicting the hierarchical relationship between programs and the Strategic Outcome(s) to which they contribute.
Report on Plans and Priorities (rapport sur les plans et les priorités): Provides information on the plans and expected performance of appropriated organizations over a three-year period. These reports are tabled in Parliament each spring.
result (résultat): An external consequence attributed, in part, to an organization, policy, program or initiative. Results are not within the control of a single organization, policy, program or initiative; instead they are within the area of the organization's influence.
statutory expenditures (dépenses législatives): Expenditures that Parliament has approved through legislation other than appropriation acts. The legislation sets out the purpose of the expenditures and the terms and conditions under which they may be made.
Strategic Outcome (résultat stratégique): A long-term and enduring benefit to Canadians that is linked to the organization's mandate, vision and core functions.
sunset program (programme temporisé): A time-limited program that does not have an ongoing funding and policy authority. When the program is set to expire, a decision must be made whether to continue the program. In the case of a renewal, the decision specifies the scope, funding level and duration.
target (cible): A measurable performance or success level that an organization, program or initiative plans to achieve within a specified time period. Targets can be either quantitative or qualitative.
voted expenditures (dépenses votées): Expenditures that Parliament approves annually through an Appropriation Act. The Vote wording becomes the governing conditions under which these expenditures may be made.
whole-of-government framework (cadre pangouvernemental): Maps the financial contributions of federal organizations receiving appropriations by aligning their Programs to a set of 16 government-wide, high-level outcome areas, grouped under four spending areas.
Endnotes
- Date modified: