
Evaluation of Community Futures Program
Table of Contents (June 2014)
- Executive Summary
- Introduction
- Evaluation Methodology
- Relevance of the Program
- Performance: Achievement of Expected Outcomes
- Performance: Efficiency and Economy
- Conclusions and Recommendations
- Management Response and Action Plan (June 2014)
Executive Summary
Introduction
The Community Futures Program (CFP) supports Community Economic Development (CED) and builds the self-reliance and capacity of communities to realize their full sustainable potential. The objectives of the CFP in support of this mandate include fostering economic stability, growth and job creation; helping to create diversified and competitive local rural economies; and helping to build economically sustainable communities. The CFP is delivered through four Regional Development Agencies in their respective regions. The CFP is designed to operate in rural communities and provides financial support to Community Future Organizations (CFs) for their activities. There are 90 non-profit CFs, 4 provincial CF Associations and one Community Futures Pan West Group in Western Canada.
CF activities include (1) fostering strategic community planning and socio-economic development; (2) providing business services by delivering a range of business, counselling and information services to small and medium-sized enterprises (SMEs) and Social Enterprises; (3) providing access to capital to assist new and existing SMEs and social enterprises; and (4) supporting community-based projects and special initiatives.
This study evaluates the relevance and performance of the CFP from 2008–09 and to 2012–13. In order to minimise duplication of effort, the evaluation draws upon findings in the CFP revitalization exercise to support some of the issues in the evaluation framework. The evaluation serves as a complement to the broader revitalization initiative.
The methodology for the evaluation included document and literature review, performance data analysis, Statistics Canada business number review, 2011 Statistics Canada census data of CF service areas, key informant interviews, surveys and case studies.
Relevance of the Program
- The overall conclusion is that there is a relevant ongoing need for the CFP in Western Canada. Evidence from the literature review indicates that SMEs face barriers to financing. Financing requests from SMEs have gone up significantly since the recession. The literature review showed that overall business lending conditions continue to ease in 2012, however, certain sub-categories continue facing greater difficulties in accessing financing such as business start-ups and exporters.
- Policies and programs such as the CFP implemented by governments support SMEs to overcome barriers to financing. Programs such as the CFP are needed in stable economic conditions and in economic downturns.
- Evidence from the key informant interviews suggests an ongoing need for the CFP, especially in the area of access to capital and business development services. The most common driver for this was related to clients unable to source funding from traditional sources because they are viewed as high risk.
- The client survey revealed that the majority of clients who applied to the CF for funding were denied funding from other sources.
- A lower number of key informants and survey respondents indicated a need for community strategic planning and community economic development in their regions. This is indicative of the fact that respondents were not very familiar with community economic development of the CF involvement in this activity. Case study respondents expressed the need for clarity in activities that constitute community economic development.
- Given the broad nature of community economic development, the evaluation advisory committee members indicated that reporting on indicators is very subjective. It will be beneficial for the department to further clarify the CFP activities in community strategic planning and community economic development in order to better reflect performance reporting in these activities.
- An assessment of other programs that provide business services indicates that such programs have specific conditions which limit their reach to specific groups of entrepreneurs. The CFs have identified mechanisms such as collaborations, partnerships and referrals to minimize overlap and duplication with other programs and funding sources.
- The 2014–15 Report on Plans and Priorities for the department aligns the CFP with the Government of Canada outcome of “Strong Economic Growth.” The objectives of the CFP align with departmental priorities in Business Productivity and Competitiveness as stated in the department’s corporate business plans from 2008 to 2012. The objectives of the CFP also aligned with the roles and responsibilities of the department as a federal government economic development agency.
Performance: Achievement of Expected Outcomes
- Using data from Statistics Canada business number review, the department was able to assess the long-term outcomes of CF-assisted firms to a comparable group of non-assisted firms. Analysis of the data demonstrated that CFs lending activity is making a difference and that CFs continued to lend to a diversified clientele base.
- The Statistics Canada business number review showed that CF-assisted firms outperformed a comparable group of non-assisted firms in terms of employment growth, survival rate and revenue growth. CF-assisted firms had an average employment growth rate of 9.5 percent compared to 4.2 percent for non-assisted firms from 2005 to 2010. CF-assisted firms had a survival rate of 76 percent five years after the start of their businesses compared to 60 percent for non-assisted firms. CF-assisted firms had a revenue growth rate of 13.8 percent compared to 6.1 percent for non-assisted firms.
- Key informants and survey respondents agreed that the absence of the CFs in their community would have a highly negative impact on business start-up, survival and growth, as well as community strategic planning and development in their service area.
- The performance data on outputs, immediate and intermediate outcomes demonstrated the effectiveness of the CFP in achieving its objectives particularly related to access to capital and business development services.
- The average number of loans per CF per year increased from 15.8 in 2002–07 to 16.8 within the period of the evaluation (2008–13).The number of loans and number of clients served by the CFs were higher in 2008 to 2010. This may have been as a result of the global economic recession within that period.
- The evaluation encountered challenges during the data collection exercise particularly on retrieving data from the software used by the CFs. Collection of client data was a burden on the CFs. Information collected from the CF into a database could not be easily imported into common software programs used by the department.
Performance: Efficiency and Economy
- Operating costs for the CFP were not available from the department’s financial systems for the calculation of efficiency measures within the evaluation period since costs to administer the CFP were mixed with other program costs. However, the department implemented a revised Program Alignment Architecture in 2013–14 with the CFP as a separate sub-program within the program activity of community economic growth. This change will enable the department to track operating expenditures in relationship to the delivery of the CFP, allowing the department to report on the efficiency of delivery of the CFP and compare the cost of delivery to that of other Regional Development Agencies in the future.
- Overall, CF loan clients leveraged $1.2 for every dollar in loans disbursed by the CFs. Using the total for all leveraged amounts for all CF activities, the CFP leveraged $4.6 for every dollar spent by the department.
- The efficient and effective use of resources by the CFs was analyzed through the ability of the CFs to meet their objectives for the program. Analysis of the Statistics Canada business numbers review indicated that CF-assisted firms perform better than the comparable group in terms of employment growth and revenue growth in addition to having a better business survival rate after five years of entry into business. This is supported qualitatively through the interviews and surveys.
- There are concerns on the management of the investment funds especially with respect to the excess amount of cash on hand. Individual CFs hold over $80 million in funds that are not invested in active business loans representing 28 percent of the value of the investment funds as at 2013. Strategies to address this are part of the CFP revitalization exercise.
- CF clients expressed satisfaction with the services they received from their CFs. The most common reason cited for client satisfaction was the one-on-one business counselling services that clients receive from CF staff. CF Managers and Chairs however provided a lower level of satisfaction for WD, in particular in relation to funding levels.
Recommendations
Based on the findings and conclusions drawn from the evaluation, the following recommendations are made to be addressed by the department.
Recommendation 1: The department should clarify CF activities that count as community economic development.
Recommendation 2: The department should examine the effectiveness of the CF reporting system to report on outcomes and ensure better integration with departmental systems.
Recommendation 3: The department should continue to work with other Regional Development Agencies on enhancing analysis of long-term outcomes using Statistics Canada data runs. The department may want to explore using this method of assessing long-term outcomes for other departmental programs.
Introduction
Background of the Community Futures Program
The Community Futures Program (CFP) supports community economic development (CED) and builds the self-reliance and capacity of communities to realize their full sustainable potential.
The objectives of the CFP in support of this mandate include:
- Fostering economic stability, growth and job creation;
- Helping to create diversified and competitive local rural economies; and
- Helping to build economically sustainable communities.
The CFP was established in 1985, as part of Employment and Immigration Canada's Canadian Jobs Strategy, with the objective of mitigating the labour market adjustment needs in non-metropolitan areas experiencing chronic or acute unemployment. The CFP created a flexible, national resource to support a bottom-up and participatory approach to community adjustment, diversification and development. The program was transferred to Regional Development Agencies (RDAs) in 1995.
The CFP is delivered through four RDAs in their respective regions: the Atlantic Canada Opportunities Agency (ACOA), Canada Economic Development Agency for the Regions of Quebec (CED-Q), Western Economic Diversification Canada (WD) and the Federal Economic Development Agency for Southern Ontario (FedDev). The Federal Economic Development Initiative for Northern Ontario (FedNor) under Industry Canada (IC) delivers the CFP in northern Ontario. Departments are accountable for the ongoing management of the Transfer Payment Program (TPP) in accordance with all policies and legislations of the Government of Canada unless otherwise noted in the Terms and Conditions of the CFP.
The CFP is designed to operate in rural communities. Program reach extends to existing and new small and medium-sized enterprises (SMEs), entrepreneurs and community groups and organizations involved in community capacity building. The program works with community stakeholders and partners that include the private sector, non-profit organizations, non-government organizations, financial institutions, equity groups, municipalities, associations, regional networks, educational organizations, labour organizations and First Nations.
The CFP provides financial support to Community Future Organizations (CFs), which are incorporated, not-for-profit organizations with volunteer boards of directors and professional staff. These organizations form a national network of more than 2,0001 volunteers who dedicate thousands of hours annually to their communities. CFs are accountable to government through terms which have been set out in their contribution agreements with Departments.
Community Futures in Manitoba, Saskatchewan, Alberta, and British Columbia
WD assumed responsibility for the CFP in western Canada in April 1995. There were 78 CFs and two CF Associations in existence at the time. Subsequent to the transfer, WD approved the creation of CF Associations in Alberta and Saskatchewan and 12 new CFs to ensure universal coverage for the West.
As at 2013–14 fiscal year, there are 90 non-profit CFs, 4 provincial CF Associations and one Community Futures Pan West (CFPW) Group in Western Canada. The four provincial CF Associations were established to provide common services and support to their member CFs. The CFPW was established as an initiative of the four western CF Associations to enhance collaboration and consistency in the use of tools and services available to all 90 CFs across Western Canada. CFs are part of WD’s Western Canada Business Service Network (WCBSN) and assist with the delivery of WD’s Entrepreneurs with Disabilities Program (EDP), as well as work with the Aboriginal Business Service Network (ABSN). Further, many CFs have been active participants in the delivery of services or programs for other government departments such as Human Resources and Skills Development Canada (HRSDC).
As per the CFP Terms and Conditions, the maximum amount of financial assistance that may be provided by a local CF to any small and medium-sized enterprises (SME) or Social Enterprise shall not normally exceed $150,000. Two or more local CFs may collaborate to provide financial assistance to SMEs or Social Enterprises in cases where there is a demonstrated benefit to their communities. Each participating CF may provide up to $150,000 in such situations.
Program Activities
As stated in the terms and conditions of the CFP, CFs receive support from the department to engage in the following activities:
- Fostering strategic community planning and socio-economic development by working with their communities to assess local problems, establish objectives, and plan and implement strategies to develop human capital, institutional and physical infrastructure, entrepreneurship, employment, and the economy.
- Providing business services by delivering a range of business counselling and information services to SMEs and Social Enterprises.
- Providing access to capital to assist existing SMEs and Social Enterprises or to help entrepreneurs to create new SMEs and Social Enterprises.
- Supporting community-based projects and special initiatives by collaborating with other partners in the public sector and the community to implement strategic community projects or deliver special initiatives targeted to communities. These projects would vary considerably from one community to another and could include a wide range of local initiatives in areas such as tourism, entrepreneurship, economic opportunities for specific client groups such as women, youth, Aboriginal people and members of official language minorities, or projects which respond to specific challenges facing a community such as downturns in important industries.
The CFP consolidates these activities as a sub-program under the program activity of Community Economic Growth within WD’s Program Alignment Architecture (PAA).
Specifically, the expected results under the CF sub-program relate to “a strong rural community strategic planning and implementation,” “access to business development services” and “access to capital and leveraged capital.”
Community Futures Program Governance Structure
Although WD is not directly involved in the operation and decision-making activities of the CFs, WD provides annual funding to the CFs. Overall responsibility for the achievement of WD results is vested with WD’s Deputy Minister, assisted by the Executive Team. Four regional Assistant Deputy Ministers report to the Deputy Minister and are responsible for program delivery in each of their respective western provinces.
Regional program managers and officers liaise with CFs to provide the annual funding. Responsibilities of the program managers and officers include:
- assessing and reviewing CF performance targets and plans in order to determine the appropriateness of renewing contribution agreements;
- assessing the risk of each CF when developing and negotiating contribution agreements in order to develop an appropriate monitoring system;
- liaising with CFs on strategic and operational issues;
- reviewing and approving CF payment claims; and
- monitoring CFs to ensure compliance with the terms and conditions of the contribution agreements between WD and the CF.
The on-going daily activities of individual CFs are directed by its volunteer Board and implemented through the management and staff of the organizations. CFs typically employ between three to five professional staff. Each CF is headed by a General Manager who reports to a Board of Directors. Typically, a loans officer and a community development officer report to the General Manager, along with administrative staff.
Community Futures Program Funding Allocations
The annual departmental expenditure for the CFP for the 2008–13 period is presented in millions of dollars (table below).
| Year | CFP Operating Funds | CFP Loan Funds | CFP Association Funds | G&C |
|---|---|---|---|---|
| 2008–09 | 27.0 | 10.0 | 0.8 | 37.8 |
| 2009–10 | 27.6 | 3.5 | 0.8 | 32.0 |
| 2010–11 | 28.4 | 0.02 | 0.9 | 29.2 |
| 2011–12 | 26.7 | 0.02 | 0.8 | 27.6 |
| 2012–13 | 28.6 | 0 | 0.8 | 29.4 |
| Total | $156.0 | |||
Source: WD Finance and Corporate Management
Evaluation of the CFP
The last evaluation of the CFP was conducted in 2008. The evaluation reported that there was a continued need for the CFP and the objectives and mandate of the program remained relevant to government responsibilities and priorities. Impacts highlighted in the evaluation indicated that CF activities supported economic growth and diversification of communities and strengthen community capacity. The evaluation provided the following recommendations:
There were two main recommendations related to the relevance section:
- WD should introduce one or two specific indicators to capture CFs’ role in pursuing collaborative relationships with other organizations (i.e. informal arrangements, memorandums of understanding, etc.) and acting as a gateway to services for their clients (e.g. number of referrals).
- WD Program Managers need to review the recent shift in WD priorities to determine how the CF Program should respond in the future.
There were two main recommendations related to the design and delivery section:
- WD should take the necessary steps to further enhance the management of the investment fund.
- WD should take the necessary steps to enhance the reliability and use of performance data.
There were two recommendations related to the impact section:
- WD needs to further define the indicators associated with the long-term outcomes of the program and ensure that data is being tracked against the established indicators.
- Subject to WD preparing a plan to implement the other recommendations in this report, WD should continue its support and long term commitment to the three services provided by the CF program.
Based on a follow-up conducted in 2011 on the status of the recommendations, most of the recommendations were completed by the department. The recommendation related to the development of specific indicators was indicated as on-going and being is addressed through the development and implementation of the national CF Performance Measurement Strategy (PMS). Decisions related to the development of a new database for the CFP was deferred by the department.
The Community Futures Performance Measurement Strategy
A national Performance Measurement Strategy (PMS) was developed by all RDAs for the CFP and contains a national evaluation framework and performance measurement framework for ongoing data collection. A committee comprised of representatives from all RDAs was responsible for coordination of its implementation. WD’s Performance Measurement Framework (PMF) for 2013–14 includes indicators derived from the national PMS which allow the department to report CFP results publicly and to parliament. The CFP performance indicators are captured in a database hosted by CommonGoals, the developer of the performance measurement software used by the majority of CFs.
Scope and Objectives of the Evaluation
The Treasury Board of Canada Secretariat (TBS) Policy on Evaluation2 requires the department to evaluate the relevance and performance of all direct programs spending every five years. As outlined in its approved 2013–14 evaluation plan, the department committed to conducting an evaluation of the CFP in 2013–14. Each RDA is required to complete an evaluation of their CFP by June 2014.
The scope of the evaluation includes CFP activities funded between 2008–09 and 2012–13. All RDAs coordinated on the evaluation of the CFP using the evaluation framework developed as part of the national PMS.
The department is currently undertaking a revitalization exercise of the CFP. The revitalization of the CFP is to ensure that the CFs become more productive, efficient and relevant to the evolving needs of western Canadian rural communities and the priorities of the federal government and the department.
The CF revitalization initiative includes a review of:
- Governance and accountability
- Performance and Alignment
- Role and structure of CF Associations
In order to minimise duplication of effort, the evaluation draws upon findings in the revitalization exercise to support some of the issues in the evaluation framework. The evaluation serves as a complement to the broader revitalization initiative.
A list of the specific questions addressed in the evaluation is provided in the following table.
| Evaluation Issues: | Evaluation Questions: |
|---|---|
| Relevance | 1. Is there a continued need for the CFP? 2. To what extent are the objectives of the CFP aligned with: i) Departmental strategic outcomes? ii) Federal priorities and strategies? 3. To what extent are the objectives of the CFP aligned with the federal government’s activities, roles and responsibilities? 4. Does the CFP complement, duplicate or overlap other government programs or private services? |
| Performance (Effectiveness) | 5. Establishing incrementality: What impact would the absence of CFP funding have had on the: Business start-up? Survival of the business? Growth of the business? Community strategic planning and development? 6. To what extent have the immediate, intermediate and ultimate outcomes of the CFP been achieved? 6.1 To what extent have CFP activities contributed to the achievement of identified immediate outcomes in: Improved access to capital? Enhanced business services? Strengthened community strategic planning? More effective implementation of CED through projects, partnerships and CED initiatives? 6.2 To what extent have the CFP activities and immediate outcomes contributed to the achievement of identified intermediate outcomes in: Improved business practices and increased entrepreneurship? Strengthened and expanded businesses? Strengthened capacity for socio-economic development? 6.3 To what extent have the CFP activities, immediate and intermediate outcomes contributed to its identified ultimate outcome in: Economic stability, growth and job creation? Diversified and competitive local rural economies? Economically sustainable communities? 7. What are the barriers to achieving the CFP immediate, intermediate and ultimate outcomes and to what extent are these being mitigated? 8. To what extent are the CFP’s performance measurement and reporting structures effective in reporting on the achievement of the CFP outcomes? How is the performance information used by CFs? By departments? |
| Performance (Efficiency and Economy) | 9. To what extent is the CFP efficient in the context of the results being achieved? 10. Is there a more cost effective way of achieving expected results, taking into consideration alternative delivery mechanisms, best practices and lessons learned? 11. Are the CF investment funds well managed? Are the loss rates of the loans acceptable? Do the CFs carry an acceptable level of risk? Are CF clients satisfied with services from the CFs? 12. To what extent are the CFs meeting the needs of clients in terms of services rendered? |
[1] 2012 Annual Report of the Community Futures Network of Canada. http://www.communityfuturescanada.ca/LinkClick.aspx?fileticket=IlRwGckP3YQ%3d&tabid=58
[2] Treasury Board Secretariat. Policy on Evaluation, 2009. http://www.tbs-sct.gc.ca/pol/doc-eng.aspx?id=15024
Evaluation and Methodology
This section describes the design, methodology and limitations of the evaluation.
Evaluation Logic Model and Framework
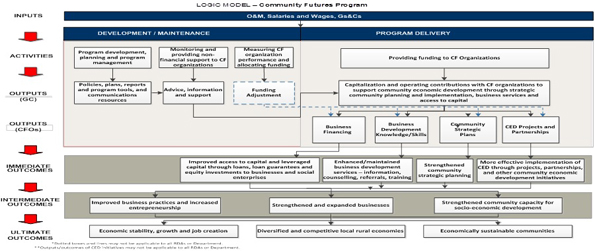
A formal logic model was developed for the Community Futures Program (CFP) as part of the national Performance Measurement Strategy (PMS). The CFP logic model is a diagram that depicts the inputs, activities, and outcomes of the CFP and the relationship between them. The model also makes the distinction between the activities and outputs of the government departments that administer the program, and those of the CFs.
Text Version, Figure 1: Logic Model – Community Futures Program
The evaluation framework for this study combines the national CFP evaluation framework developed as part of the national PMS and feedback received during the evaluation planning process to reflect coverage of five core issues as per the Treasury Board Secretariat Directive on Evaluation.3
Evaluation Approach and Methodology
A literature review of approaches to evaluating community development programming4 suggests that an evaluation of the CFP requires a mixed-methods research design involving multiple lines of evidence gathered through both quantitative and qualitative methods. Quantitative methods such as data analysis and surveys can be relied upon when describing activities, outputs and short-term impacts. Qualitative methods such as interviews and document review play a critical role in studying intermediate and longer term outcomes. A mixed methods approach allows for triangulation (i.e. convergence of results across lines of evidence) and complementarity (i.e., developing better understanding by exploring different aspects of an evaluation issue).
CFP Evaluation Advisory Committee
An advisory committee was established to provide the evaluation team with input, advice and suggestions regarding the conduct of the study, resolve ambiguous or contentious issues and ensure that the Evaluation Team produces a balanced, objective and credible report. The members were drawn from the department and external sources (CFs and CF Associations). A Terms of Reference guided the operation of the advisory committee.
Preliminary Consultations
Preliminary consultations were conducted with WD corporate and regional staff to develop the Terms of Reference for the evaluation. The terms of reference, including the evaluation framework, was reviewed by the advisory committee, the department’s Directors General of Operations Committee and Executive Committee. The Terms of Reference was finalised after these consultations.
Document and Literature Review
A review was conducted of the department’s documents as well as literature relevant to the CFP. The review of documents was used to assess program relevance and performance. Three main types of documents were assessed and analyzed during the evaluation:
- General background documentation (e.g. WD documents that describe the program’s history, rationale and program theory, etc.).
- Industry Canada reports on SMEs in Canada.
- Program and policy documentation (e.g., Terms and Conditions of the CFP, CF performance reports, CF’s websites, information on CF revitalization process, CF operational documents and manuals, the national PMS, etc.).
- Past evaluations of the CFP and literature related to community development programming.
Performance Data
The evaluation project team undertook a detailed analysis of project data from 2008–09 to 2012–13 to create a profile of activities implemented through the program. The performance data provided a comprehensive perspective of the outputs and activities of the program (such as statistics on program activities, loans, business support services, etc.). This data is reported by the CFs into a database hosted by CommonGoals5 on a quarterly and/or annual basis. Project data was supplemented by data from the department’s financial and human resource systems where possible.
Statistics Canada Business Number Review
As per a contract established with Statistics Canada, the department was provided with client data on employment, sales and survival rates to be used to report on CFP indicators such as business entry and exit, employment growth and business survival rates. Statistics Canada completed four data runs which were used as the basis for establishing performance targets by the department. In order to facilitate this process, the department provided Statistics Canada with a list of business numbers of their CF clients. Data was received from Statistics Canada at an aggregate level and the department analysed and reported on the data for the evaluation. Comparable6 firms to CF-assisted firms were identified based on postal codes or census division in areas serviced by CFs. The evaluation relied on results from the 2000 to 2010 run of data.
Census Data
Statistics Canada produced customized data profiles for each of the CF service areas. This data, compiled from the 2006 and 2011 census, provided key information required for the evaluation such as population in each CF service area, labour force participation rates, unemployment rates, average household income and employment by industrial sector. The following table shows the distribution of the population served by the CFP in the various regions of Western Canada.
| Province | Number of CFs | Population Served |
|---|---|---|
| Manitoba | 16 | 530,670 |
| Saskatchewan | 13 | 616,725 |
| Alberta | 27 | 1,588,310 |
| British Columbia | 34 | 1,726,740 |
| Total | 90 | 4,993,115 |
Key Informant Interviews
Semi-structured interviews were completed with 60 internal and external stakeholders. Key groups are identified in the table below:
| Stakeholder Type | Planned | Completed |
|---|---|---|
| Internal WD management and staff | 10 | 11 |
| Representatives from CF network organizations | 10 | 5 |
| Account managers of financial institutions | 10 | 9 |
| Organizations involved in similar activities as the CFP | 10 | 9 |
| Community groups/leaders | 10 | 14 |
| External stakeholders/subject matter experts | 10 | 12 |
| Total | 60 | 60 |
Case Studies
Case studies are an effective evaluation method to demonstrate program successes and challenges. While not representative of the entire program, selected case studies are useful for providing examples and demonstrating the effectiveness of the program. Case studies may also be used to illustrate the complexities surrounding the CFP and the contextual elements in which it operates.
A total of 8 case studies (2 per region) were selected for the evaluation based on size, service focus (business vs. community economic development and planning), geographic location and consultation with the CFP Evaluation Advisory Committee. The case study methodology included site visits to each of the 8 CFs to review documents and interview the CF Manager, a Board Member and at least 3 CF clients. The list of CFs selected for the case studies are below.
| Selected CF | Province | City | Size of Population* |
|---|---|---|---|
| Central Okanagan CF | BC | Kamloops | 179,840 |
| Central Interior First Nations CF | BC | Kamloops | 9,325 |
| CF Lethbridge | AB | Lethbridge | 115, 605 |
| CF Peace Country | AB | Peace River | 45,140 |
| South Central CF | SK | Moose Jaw | 54,540 |
| Newsask CF | SK | Tisdale | 45,315 |
| CF Greenstone | MB | Flin Flon | 7,330 |
| Cedar Lake CF | MB | The Pas | 15,965 |
Surveys
Survey of CF Organizations
To gain insights on the relevance and performance of the CFP, a survey was conducted of the CFs not included in the case studies. For each CF, two survey instruments were circulated: one for the CF Managers and one by the CF Board Chairpersons. A total of 65 CF Managers (79 percent) and 40 CF Chairs (49 percent) completed the survey (response rate of 64 percent). The estimated response rates by province and by respondent type are as below.
| Alberta | British Columbia | Manitoba | Saskatchewan | Total | |
|---|---|---|---|---|---|
| Valid contacts | 51 | 63 | 28 | 22 | 164 |
| Non-response rate | 33% | 33% | 54% | 27% | 36% |
| Response rate | 67% | 67% | 46% | 73% | 64% |
| CF Manager | CF Chair | Total | |
|---|---|---|---|
| Valid contacts | 82 | 82 | 164 |
| Non-response rate | 21% | 51% | 36% |
| Response rate | 79% | 49% | 64% |
CF Client Survey
A survey was conducted with CF clients (including non-recipient loan clients) to collect information on the activities and outcomes of the CFP. Clients were surveyed for insights on program delivery and outcomes. Surveys were expected to inform relevance and performance of the CFP.
In building the sampling frame, CFs were asked to provide the names, positions, telephone numbers and email addresses of all of their clients. Information related to loan amounts, types of services received, time frame for receipt of services and supports for clients was collected through the questionnaire.
The response rates and actual completions were monitored closely after survey implementation to ensure that the survey was being implemented appropriately. The survey was sent by email to 5,743 clients. Emails of 1,195 clients were invalid. A total of 1024 clients started the survey and 893 clients completed it for a response rate of 20%. The estimated response rates by province and by respondent type are as below.
| Alberta | British Columbia | Manitoba | Saskatchewan | Total | |
|---|---|---|---|---|---|
| Valid contacts | 1,032 | 2,999 | 294 | 223 | 4,548 |
| Non-response rate | 78% (806) | 83% (2494) | 70% (207) | 66% (148) | 80% (3655) |
| Response rate | 22% (226) | 17% (505 ) | 30% (87) | 34% (75) | 20% (893) |
| Loan Clients | Non-loan Clients | Total | |
|---|---|---|---|
| Valid contacts | 2,148 | 2,400 | 4,548 |
| Non-response rate | 71% (1,528) | 89% (2,127) | 80% (3,655) |
| Response rate | 29% (620) | 11% (273) | 20% (893) |
CF Client Profile: The majority of CF clients (83 percent) indicated that their organizations or businesses were currently operating. About 6 percent indicated that their organizations or businesses were still in the planning stage but not yet operating. About 5 percent indicated that their organization or business had permanently stopped operations. About 7 percent of the CF Clients indicated that their organizations or businesses had temporarily stopped operations, been sold or will not proceed. About 12.4 percent of the CF clients were in the retail trade and 7 percent were in the accommodation and food services sector. The remaining was split among various other sectors as shown below.
Text Version, Figure 2: Business Sector

Most clients (68.8 percent) received loans from the CF and assistance in the development of a business plan (36.6 percent).
CF Partner Survey
CFs provided administrative data on names, position, telephone numbers and email addresses of partner organizations. Due to time and resource constraints, most CFs elected to provide a sample of 10 – 25 Partners. In the event a region was over-represented, the survey data was weighted accordingly.
The survey was sent by email to 1,329 partners based on the contact information provided by CFs. Emails sent to 106 of the addresses were invalid. A total of 301 clients completed the survey for a response rate of 24.6 percent. The estimated response rates by province are below.
| Alberta | British Columbia | Manitoba | Saskatchewan | Total | |
|---|---|---|---|---|---|
| Valid contacts | 279 | 727 | 151 | 66 | 1223 |
| Non-response rate | 67% (186) | 78% (565) | 85% (129) | 64% (42) | 75% (922) |
| Response rate | 33% (93) | 22% (162) | 15% (22) | 36% (24) | 25% (301) |
Evaluation Challenges and Limitations
- Potential for respondent bias. The evaluation findings are based, in part, on the views of key informants and survey respondents with a vested interest in the CFP program and potentially biased in their responses regarding outcomes. Several measures were taken to reduce the effect of respondent biases and validate interview results, including the following: (i) ensuring that respondents understood the strict confidentiality of responses; (ii) including key informants and survey respondents who do not have any vested interest in the CFP or were unsuccessful in their loan applications to the CF; and (iii) asking respondents to provide a rationale for their ratings, including a description of specific activities which contributed to reported outcomes.
- Surveys: The ability of the evaluation to conduct a survey was impacted by a) the completeness and quality of contact information provided by CFs; and b) the willingness of respondents to participate in the surveys. In the event a region was over-represented, the survey data was weighted accordingly. If a group was under-represented, targeted follow-up calls and/or emails were made to enhance the representativeness of the survey responses.
- Case Studies: Case studies are typically expensive and time consuming to carry out. As explained above, it is not possible to analyze a statistically reliable sample and consequently, case studies are not expected to make statistical generalization of the results. To partially address this limitation, the results from the case studies are used to support findings in other lines of evaluation evidence. In addition, documents reviewed during the case studies included those obtained directly from the CF. Because this may include those documents the CFs believe are important for the evaluation, there is a potential for a selection bias. Information was therefore analyzed together with internal departmental information to reduce this bias.
- Attribution/Contribution: As with most of WD programming, other factors will contribute to the expected results/outcomes of CFP. This challenge is particularly relevant for community based programming, given that multiple factors (i.e., multiple funding partners, influence of volunteer boards and other initiatives delivered by the CFs on behalf of other organizations) can influence outcomes while trying to isolate WD’s specific influence on these outcomes. The evaluation team addressed this challenge of attribution by using Statistics Canada data to compare CF-assisted firms versus non-assisted firms.
- Data availability for assessing efficiency/economy: Accurate data on the operational costs of administering programs at WD is often limited or not available which prohibits an extensive analysis of program efficiency and economy. Alternative ways of assessing efficiency and economy was undertaken, such as seeking out opportunities for more optimal use of resources in program governance and delivery through CFP performance data and key-informant interviews.
[3] Treasury Board Secretariat. Directive on Evaluation, 2009 http://www.tbs-sct.gc.ca/pol/doc-eng.aspx?id=15681
[4] Community Development Evaluation Research, Published by Community Waitakere, New Zealand, August 2012 http://www.communitywaitakere.org.nz/images/research1.pdf.
[5] CommonGoals is a company that developed The Exceptional Assistant (TEA) software used by the CFs to report on performance to the department.
[6] "Comparable firms"? those that are of similar age, size, sector and geographic region, but that have not received a direct monetary contribution from CFs.
Relevance of the Program
This chapter summarizes the major findings of the evaluation with respect to the continued need for the program, relationship with other programming and alignment with departmental and federal government roles and responsibilities.
Continued Need For The Program
Access to Capital and Business Development Services
The Canadian Provinces: Key Small Business Statistics published by Industry Canada in September 20137 noted that SMEs represented close to 99.9 percent of all business establishments providing about 89.9 percent of all jobs in the Canadian economy. The distribution of business establishments in the publication in Western Canada is provided in the table below.
| Province | Business establishments with employees | Small businesses (1–99 employees) | Medium-sized businesses (100–499 employees) | Large businesses (500+ employees) | Percentage of SMEs |
|---|---|---|---|---|---|
| Manitoba | 35,980 | 35,298 | 622 | 60 | 99.8 |
| Saskatchewan | 38,749 | 38,264 | 457 | 28 | 99.9 |
| Alberta | 154,495 | 151,866 | 2,397 | 232 | 99.8 |
| British Columbia | 171,557 | 169,178 | 2,218 | 161 | 99.9 |
The publication shows that a significant proportion of SMEs in Western Canada is located in rural areas in Manitoba (28.9 percent), Saskatchewan (45.1 percent), Alberta (16.7 percent) and British Columbia (11.8 percent). Alberta and Saskatchewan have the highest number of SMEs relative to the total working age population (50.3 SMEs per 1,000 inhabitants in Alberta and 47.8 in Saskatchewan) in Canada. In addition, Saskatchewan ranks first in terms of the proportion of high-growth8 SMEs (13.2 percent), followed by Alberta (9.3 percent) and British Columbia (9.2 percent) in Canada.
The Credit Conditions Survey published by Industry Canada9 on SME financing provides information on changes in access to capital conditions for SMEs. The publication states that SME financing requests have gone up significantly since the recession. 34 percent of SMEs requested financing in 2012 compared with 16 percent in 2009. Approximately 44 percent of SMEs that requested financing in 2012 reported doing so to support day-to-day working and operational capital expenditures. The publication concludes that overall, business lending conditions continued to ease in 2012, however, certain sub-categories of businesses such as start-ups and exporters continue to face greater difficulties in accessing financing.
The Organization for Economic Co-operation and Development (OECD) Working Group on SMEs and Entrepreneurship in a report10 recognises that SMEs and entrepreneurs play a significant role in all economies and are the key generators of employment and income and drivers of innovation and growth. The paper stated that access to capital continues to be one of the most significant challenges for the creation, survival and growth of SMEs. This was particularly evident during the fallout from the 2008-09 financial crises. The report concluded that even in stable economic conditions governments recognised that to survive and grow, SMEs need specific policies and programs. The Working Group supported moves by governments to implement policies and programs such as the CFP in response to the financing needs of SMEs.
The CFP was implemented to provide access to capital, business development services and community economic development in rural Canada. The evidence from the key informant interviews suggests there is a demonstrated and ongoing need for the CFP in all areas particularly in access to capital and business development services. The majority of respondents across respondent types indicated that there is an ongoing need for the program. Respondents provided a rating of 4.6 (out of 5) on the need for access to capital. The most commonly reported driver of this need was related to providing loans to clients who were unable to access funds from other sources because they are viewed as high risk by traditional lenders (particularly in rural and/or smaller communities). The mean rating for the need for business development services was slightly higher than for access to capital with a score of 4.74 (out of 5).
Survey findings indicate that CF Managers and Board Chairs strongly believe that the need for CFP services exists to a great extent (97 percent). A large majority of respondents reported a high need for access to capital (98 percent) and business development services (97 percent). The majority of CF clients (79 percent) and CF Partners (78 percent) indicated that the need for the various CFP services in their region exists to a great extent. The majority of CF partners reported a great need for access to capital (72 percent) and business development services (78 percent).
An Industry Canada report on SME financing11 identified a category of SMEs, which it termed as discouraged borrowers. These categories of SMEs have a need for financing but do not actively seek financing because they believe, correctly or not, that their requests will be turned down. This belief stems from a variety of factors, including: the rejection of past requests; a shortage of capital in the region or industry sector; discrimination; poor or lack of credit history; lack of equity; lack of collateral to pledge as security; and lack of expertise and/or managerial skills. In the 2010 Industry Canada Credit Conditions SME Survey, it was determined that approximately 3 percent of SMEs that did not apply for financing chose not to do so because they thought their request would be turned down. These SMEs sometimes turn to programs such as the CFP to address their financing needs.
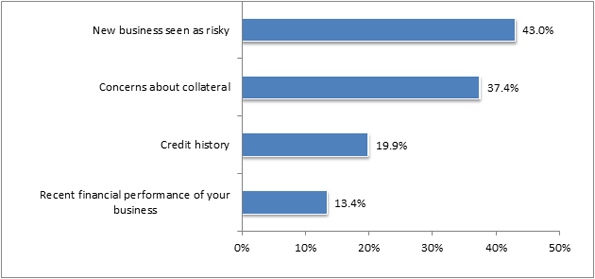
CF clients interviewed for the case studies viewed the CFs as their last resort to secure funding to start, maintain or expand their businesses. The client survey revealed that the majority of clients who applied to the CF for funding were previously denied funding from other sources (56 percent). Some clients (17 percent) noted that the CF loan assisted them in securing funding from other sources. The table below indicates the most common reasons that clients provided for not being approved for loans from other institutions.
Text Description, Figure 3: Common Reasons CF Clients not approved for loans from Other Organizations
The CFP exists to provide access to capital and business development services to SMEs and entrepreneurs who would otherwise not be able to access these services from traditional banking institutions.
Community Strategic Planning and Community Economic Development
The terms and conditions of the CFP provides for the CFs to undertake activities related to community strategic planning12 and support for community economic development13. Survey respondents indicated a need for community strategic planning and community economic development in their regions. However, respondents provided a lower rating for this compared to the need for access to capital and business development services. The survey of CF Managers and Board Chairs provided a rating of 80 percent on the need for community strategic planning compared to a rating of 97 percent on the need for access to capital and 98 percent on business development services. CF Partners surveyed provided a rating of 72 percent on the need for access to capital and 78 percent on business development services compared to a rating of 63 percent for community strategic planning.
Respondents in the key informant interviews saw a lower need for community strategic planning and community economic development activities with an overall mean of 4.26 across respondent types. A lower number of key informants (31 out of 60) were able or willing to provide a response which is likely indicative of the fact that they were not familiar with CF involvement in activities related to community strategic planning and community economic development. Some case study respondents expressed the need for better clarity from the department around activities that would be classified as community economic development. The emphasis on community strategic planning and community economic development activities vary by community depending on the resources of the CF. Some CFs invest a large portion of their time and effort in this while other CFs are primarily involved in access to capital and business development services.
Some key informants indicated the demand for community strategic planning and community economic development activities had been decreasing as the communities developed the capacity to undertake these activities themselves. Almost all case study respondents indicated the absence of dedicated CF resources to undertake community strategic planning and community economic development activities. In most cases, community strategic planning and community economic development activities were undertaken by the CF Manager. Given the broad definition for community economic development activities, some case study respondents expressed the need for clarity from the department on this objective. In addition, it was recognized by evaluation advisory committee members that reporting in this activity is quite subjective. It will be beneficial for the department to further clarify the CFP activities in community strategic planning and community economic development in order to better enable accurate performance reporting. The consensus among key informants was that a decrease in resource levels is likely to result in a decrease in some CFP services especially in community strategic planning and community economic development.
Gaps in CFP Services
In terms of possible gaps in services that CFs could be addressing, most evaluation respondents did not offer any suggestions. Case study clients and some key informants suggested the need for the CFs to do more to promote their services in their catchment areas. Case study clients expressed challenges for their businesses in finding and maintaining skilled employees and suggested that the CFs could provide training to help their clients in this area.
Complementarity/Duplication/Overlap with Other Organizations
Traditional financial institutions such as banks and credit unions in the communities served by the CFs offer business services such as access to capital for entrepreneurs.
Respondents in the evaluation provided suggestions on federal organizations that provided business services in their communities. The organizations most commonly mentioned include:
- Business Development Bank of Canada (BDC) – The BDC is a financial institution owned by the Government of Canada. The BDC delivers financial and consulting services to SMEs in Canada, with a particular focus on the technology and export sectors of the economy.
- Canada Youth Business Foundation (CYBF) – Funded by the federal government, the CYBF is a non-profit organization founded in 1996 that provides young entrepreneurs with loans and mentoring services. Entrepreneurs must be between the ages of 18 and 34 to qualify for assistance form the CYBF. Young entrepreneurs can obtain up to $15,000 in start-up capital.
- Canada Small Business Financing Program (CSBFP) – The CSBFP is funded by the federal government and delivered through traditional financial institutions to help SME start-ups and established firms improve and expand. The program provides up to $500,000 in loans to qualifying SMEs. The financial institutions are required to take security in the assets financed.
- Women's Enterprise Initiative (WEI) – Funded by the department, the WEI provides assistance to women entrepreneurs including advisory services, training options, networking opportunities, business loans and referrals to complementary services.
Provincial governments also provide programs which provide business services in the communities served by the CFs. The programs include:
- Business Start Program – The Business Start Program funded by the provincial government of Manitoba provides up to $30,000 in loans to start-ups through participating financial institutions. Participants are required to contribute 40 percent of the loan amount requested.
- Small Business Loans Association (SBLA) Program – Funded by the provincial government of Saskatchewan, the SBLA program makes funds (up to $20,000) available to entrepreneurs through local, community-run associations. Some CFs in Saskatchewan are involved in delivering this initiative on behalf of the provincial government.
The evaluation team explored the potential for overlap with the traditional financial institutions and the BDC, CYBF, CSBFP and WEI. Specifically, the BDC and traditional financial institutions have a greater urban/larger community presence, serve more established businesses, offers larger loans and charge for their business development services. Traditional financial institutions have a lower risk tolerance, spend less time working with clients to develop the business idea and work primarily with "bank-ready" clients. While credit unions have more flexibility to work with more risky clients, their risk tolerance was generally viewed to be lower than that of the CFs. The CSBFP is accessed through financial institutions and thus clients are subject to the same requirements as banks and credit unions. The CYBF and the WEI provide services to entrepreneurs who are youth or women respectively. The CFP does not have such limitations and therefore provide services to a much broader entrepreneur group.
Most key informants and survey respondents reported that the CFP does not duplicate or overlap other federal, provincial or other programs. Key informants identified mechanisms in place to minimize overlap and duplication. The most commonly mentioned mechanisms were collaborations, partnerships and referrals among complementary programs. CF Managers in the case studies indicated that the CFs and some of the financial institutions in the community do refer clients to each other. In some cases, the CFs assisted clients with the development of business plans in order for them to secure funding from other institutions. The CFs in some instances collaborate with other institutions to provide loans to the same client and share the risks. Some CF clients upon rebuilding their credit history are able to secure lower interest loans from other institutions rather than to pay the higher interest loans from the CFs.
Alignment with Departmental and Federal Government Priorities
The terms and conditions of the CFP states the ultimate objectives as Economic stability, growth and job creation Diversified and competitive local rural economies Economically sustainable communities.The 2014–15 Report on Plans and Priorities for the department aligns the CFP with the Government of Canada outcome of "Strong Economic Growth." The objectives of the CFP align with departmental priorities in Business Productivity and Competitiveness as stated in the department's corporate business plans from 2008 to 2012. The Speech from the Throne on October 201314 emphasized the federal government's top priority as job creation for Canadians. The objectives of the CFP align with this priority.
Key informants indicated that there is appropriate alignment between the objectives of the CFP and federal priorities/strategies. Job creation and economic development were the most commonly cited areas of alignment.
Consistency with Federal Roles and Responsibilities
The objectives of the CFP aligned with the roles and responsibilities of the department as a federal government agency. The mandate of the department is to promote the development and diversification of the economy of Western Canada and to advance the interests of the West in national economic policy, program and project development and implementation. The department delivers programs such as the CFP to create strong and sustainable communities.
Most key informants and survey respondents indicated that the CFP is aligned with the federal government's roles and responsibilities. The most common reasons for alignment included the fact that CFP represents a unique federal presence in communities and drives economic development in the communities. Federal government involvement in the program was also viewed as providing program stability.
[7] http://www.ic.gc.ca/eic/site/061.nsf/eng/h_02816.html
[8] "Growth-rate" indicated by firms that have grown 20 percent between 2006 and 2009 as stated in data from Statistics Canada and the Organisation for Economic Cooperation and Development.
[9] Credit Condition Trends 2009–2012. Published by Industry Canada in November 2003 http://www.ic.gc.ca/eic/site/061.nsf/eng/02829.html
[10] The Impact of the Global Crisis on SME and Entrepreneurship Financing and Policy Responses. Report published by the OECD in 2009 http://www.oecd.org/industry/smes/43183090.pdf
[11] Small Business Access to Financing: Request and Approval Rates, Interest Rates and Collateral Requirements. Published by Industry Canada on July 2013
[12] The CFs partner with other local organizations to develop and update strategic plans that guide local economic development. CFs may lead in strategic planning by bringing together community groups in the development of the plans.
[13] CFs serves as partners and provides financial and in-kind support (e.g., advice, information and administrative support) for community-based projects and special initiatives.
[14] http://speech.gc.ca/eng/full-speech
Performance: Achievement of Expected Outcomes
This chapter summarizes the key findings of the evaluation regarding the incrementally, outputs, immediate, intermediate and ultimate outcomes of CFP activities, as well as factors contributing to and constraining effectiveness. The chapter also examines the performance measurement activities of the CFP.
Incrementally
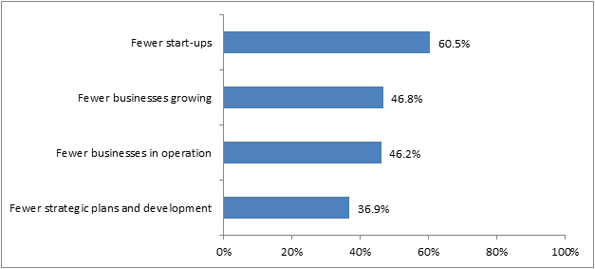
Most CF Managers and Chairs agreed that the absence of the CFs in their community would have a highly negative impact on start-up, survival, growth of new businesses, and community strategic planning and community economic development in their service area. About 95 percent of respondents indicated an absence of CFs would results in fewer start-ups, 83 percent indicated there would be fewer businesses growing and 81 percent indicated fewer businesses in operation. 62 percent of respondents indicated the absence of CFs would result in fewer community strategic planning and community economic development activities in their service areas.
The client survey noted that the absence of the CF in their community would negatively impact their businesses to a great extent as shown in the figure below.
Text Description, Figure 4: Proportion of clients who believe the absence of CF funding would have an impact on their businesses
The majority of clients (70 percent) indicated that it was unlikely or very unlikely that they would have been able to start, maintain, or expand their business without the financing they received from the CFs. Most clients (76 percent) indicated that it was very likely that they would have delayed starting or expanding their business if they had not received a CF loan. About 53 percent of clients indicated that it was very likely their businesses would be smaller if they had not received the CF loan. Clients also indicated that they would likely have reduced the quality of their services or been unable to secure funding from other sources in the absence of a CF loan.
These findings are consistent with a 2009 research study of the Canada Small Business Financing Program (CSBFP).15 The study concluded that loan recipients under the CSBFP scored more poorly on indicators of credit worthiness than counterparts who did not receive loans from the program. This would affect their ability to secure loans in the absence of the program and thus impact negatively on business performance.
The CF Partners surveyed for the evaluation supported the findings and suggested that a lack of CF funding would negatively impact businesses to a great extent as shown in the figure below.
Text Description, Figure 5: Proportion of CF Partners who believe the absence of CF funding would have an impact on businesses.

The majority of key informants (63 percent) stated that the absence of CFP funding would have a significant negative impact on their community. More specifically, respondents identified the impact as reduced access to capital and business development services for start-ups.
Outputs and Immediate Outcomes
The immediate outcomes as identified in the logic model for the CFP are:
- More effective implementation of community economic development (CED) through projects, partnerships and CED initiatives. Improved access to capital;
- Enhanced business services;
- Strengthened community strategic plans; and
- More effective implementation of community economic development (CED) through projects, partnerships and CED initiatives.
The analysis of performance data from the CFs provided information on the achievement of outputs and immediate outcomes.
Improved Access to Capital
As shown in the table below, the CFs issued a total of 3,533 new loans during the period of the evaluation. The highest numbers of new loans were issued in the 2008–09 to 2009–10 fiscal years. This may be reflective of the greater demand for access to capital as a result of the global economic recession. Compared to the findings in the 2008 evaluation, the average number of loans per CF per year has risen from 15.8 in 2002–07 to 16.8 in the current evaluation period. The average size of loans remained fairly constant over the period. The highest value of loans was realised in the 2009–10 fiscal year.
| Fiscal Year | Number of New Loans | Number of Existing Loans | Total Number of Loans | Average Number of Loans | Value of Loans | Average Size of Loan |
|---|---|---|---|---|---|---|
| 2008–09 | 746 | 771 | 1,517 | 16.9 | $77,875,409 | $51,335 |
| 2009–10 | 761 | 838 | 1,599 | 17.8 | $79,354,060 | $49,627 |
| 2010–11 | 651 | 823 | 1,474 | 15.7 | $71,430,285 | $48,460 |
| 2011–12 | 652 | 791 | 1,443 | 16.0 | $67,680,302 | $46,903 |
| 2012–13 | 723 | 874 | 1,597 | 17.7 | $78,728,223 | $49,298 |
| Average/year | 707 | 819 | 1,526 | 16.8 | $75,013,656 | $49,157 |
Enhanced Business Services
A total of 284,691 clients (average of 633 clients per CF per year) accessed business development services from the CFs over the period of the evaluation. As shown in the table below, a greater number of clients accessed CF business development services in the fiscal years 2008–09 to 2009–10, which may have been a result of the global economic recession. This is consistent with the greater number of new loans issued by the CFs in that year. The table also shows the various types of services accessed by clients.
| Fiscal Year | Number of Clients | Number of Advisory Services | Number of Information Services | Number of Website Information Services | Number of Training Sessions | Number of Training Session Participants |
|---|---|---|---|---|---|---|
| 2008–09 | 66,931 | 41,238 | 193,414 | 923,064 | 4,008 | 28,370 |
| 2009–10 | 66,840 | 50,237 | 225,065 | 733,907 | 4,473 | 31,594 |
| 2010–11 | 58,531 | 45,908 | 271,544 | 789,959 | 4,049 | 27,580 |
| 2011–12 | 58,749 | 43,545 | 255,057 | 746,871 | 3,402 | 32,866 |
| 2012–13 | 33,640 | 31,153 | 202,348 | 800,682 | 2,819 | 19,352 |
| Average/CF per year |
633 | 471 | 2,550 | 8,877 | 42 | 311 |
Results from the client survey indicated that clients were selective in accessing specific business development services offered by the CFs. The services respondents reported accessing the least often were referrals to other organizations (10 percent) and business skills training services (16 percent).
More effective implementation of CED through projects, partnerships and CED initiatives
Information from the performance data indicates that the CFP averaged 34.3 CED projects per CF per year over the period of the evaluation. This is higher than the 2008 CFP evaluation which indicated an average of 17 CED projects per year. The performance data indicated the number of community strategic plans to be an average of 4 per CF per year which is consistent with the 2008 CFP evaluation where CFs reported being involved in the development of 1 to 4 community strategic plans per CF per year. The number of partnerships increased from an average of 30 per CF per year (2008 Evaluation result) to an average of 38.4 partners per CF per year within the period of the current evaluation.
| Fiscal Year | Number of CED Projects | Number of Projects of Leadership and/or Expertise | Number of Community Plans | Number of Partnerships Developed and Maintained |
|---|---|---|---|---|
| 2008–09 | 2,721 | 3,523 | 387 | 3,360 |
| 2009–10 | 2,958 | 3,392 | 367 | 3,535 |
| 2010–11 | 3,247 | 3,343 | 341 | 3,423 |
| 2011–12 | 3,202 | 3,271 | 352 | 3,626 |
| 2012–13 | 3,292 | 2,987 | 340 | 3,336 |
| Total | 1,5420 | 16,516 | 1,787 | 17,280 |
| Average/year | 34.3 | 36.7 | 4.0 | 38.4 |
Community strategic plans involve activities where the CF led, facilitated or participated in the development of community plans. Case study respondents indicated that CFs are consistently called upon by the by the community to help in the developments of community plans. Community economic development projects included events such as youth camps, trade shows and school achievement projects. An example of such an event is the Youth Business Excellence Awards hosted by the Community Futures Newsask in Saskatchewan. The CF has been hosting this event for the past twelve years to recognise the achievements of young entrepreneurs in Northeast Saskatchewan.
The CF partner survey described the types of partnership engagements with the CFs. Partnership projects spanned a range of sectors. The following describes the nature of the projects:
- Promotion of the community for tourism or investment;
- Sponsorship of business management and entrepreneurial training courses and seminars;
- Development of infrastructure to support economic development;
- Special initiatives to support entrepreneurship among specific groups such as women, youth; Aboriginal people and official language minorities; and
- Support for communities when there is a downturn in the economy.
Partners reported benefits of partnership with the CFs, which included enhanced linkages between partners to address community needs, increased sharing of knowledge and experience, added capacity to service delivery to extend reach and accessibility of services and increased coordination of services for clients.
Intermediate Outcomes
The intermediate outcomes identified in the logic model for the CFP are improved business practices and increased entrepreneurship, strengthened and expanded businesses and strengthened capacity for socioeconomic development.
Improved Business Practices and Increased Entrepreneurship And Strengthened and Expanded Businesses
The table below indicates the number of businesses assisted by the CFs through lending activities and business services reported by the CFs in the performance database. The numbers indicate an increasing trend in the number of businesses assisted through lending activities and a decreasing trend in the number of businesses assisted through business services.
| Fiscal Year | Number of Businesses created/maintained/expanded through Lending Activities | Number of Businesses created/maintained/expanded through Business Services |
|---|---|---|
| 2008–09 | 1,272 | 1,447 |
| 2009–10 | 1,515 | 1,388 |
| 2010–11 | 1,438 | 1,239 |
| 2011–12 | 1,493 | 1,191 |
| 2012–13 | 1,478 | 792 |
| Total | 7,196 | 6,057 |
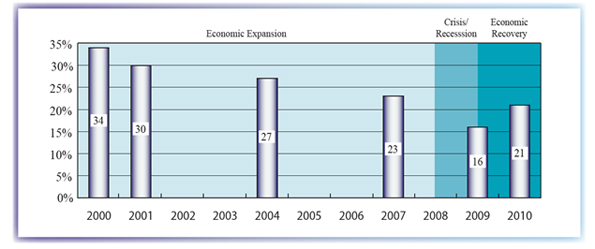
The increasing trend in lending activities of the CFs is consistent with Industry Canada’s research on SME financing16. As shown in the figure below from the report, as the economy started to recover in 2010, credit request rates for SMEs increased to 21 percent, up from 16 percent in 2009.
Text Description, Figure 6: Small business financing request rates
The Industry Canada research report on SME credit conditions17 states that the request rate for start-up and young businesses (2 years old or younger) at 36 percent was significantly higher than for older more established businesses (23 percent). However, the approval rate was much lower at 79 percent versus 91 percent respectively. This indicates higher financing needs for start-up and for younger businesses, which usually lack retained earnings, solid credit histories, and collateral to pledge for financing from traditional sources. Such start-up and young businesses may therefore seek out programs such as the CFP which provide loans to more risky clients.
CF clients surveyed for the evaluation indicated that the CF services they received improved their business skills and helped them keep the business open. About 15 percent of CF clients surveyed indicated that the services they received contributed to increasing their revenue and improving their business productivity. These clients reported that on average their sales revenue increased from $234,000 in 2008–09 to $436,000 in 2012–13.
Strengthened Capacity for Socioeconomic Development
The CF performance data also provides an indication of the level of strengthened capacity for socioeconomic development through community economic development activities (table below)
| Fiscal Year | Number of Instances Facilitating Community Involvement | Number of Instances of Increased Capacity | Number of Development of Economic Stimuli | Number of Enhanced Community Services/Facilities |
|---|---|---|---|---|
| 2008–09 | 899 | 936 | 533 | 405 |
| 2009–10 | 974 | 996 | 534 | 450 |
| 2010–11 | 905 | 1,032 | 565 | 492 |
| 2011–12 | 968 | 1,013 | 647 | 554 |
| 2012–13 | 1,034 | 1,007 | 513 | 613 |
| Total | 4,780 | 4,984 | 2,792 | 2,514 |
Facilitating community involvement includes CF facilitated events such as town hall meetings and public strategic planning sessions which contribute to strategic planning. Increased capacity involves activities such as workshops, regional roundtables and mentorship programs. Economic stimuli involve activities such as development of tourism marketing strategy, development of business plan for business incubators and establishment of cluster agreements. Enhanced community services/facilities include physical infrastructure and cultural/recreational infrastructure.
The surveyed CF Managers and Chairs reported that CF involvement in their core activities contributed to each of the immediate outcomes to a great extent. The most significant impacts were reported for improved business practices and increased entrepreneurship and strengthened and expanded businesses at 97 percent. Impacts on strengthened capacity for socio-economic development were reported to a lesser extent at 71 percent. Most CF partners surveyed indicated that their partnership with the CF in their community contributed to strengthened capacity for socio-economic development (75.4 percent), strengthened and expanded businesses in the community (73.3 percent) and improved business practices and increased entrepreneurship activities (72 percent).
Ultimate Outcomes
The ultimate outcomes of the CFP from the logic model are economic stability, growth and job creation; diversified and competitive local and rural economies and economically sustainable communities. These outcomes link to the departmental outcomes of having western Canadian communities that have strong businesses, capacity for socioeconomic development and the necessary public infrastructure to support economic growth. The objectives of the CFP therefore contribute to the departmental strategic outcome of a growing and diversified western Canadian economy.
Using business tracking data compiled by Statistics Canada, the long-term performance of CF-assisted firms was compared in terms of employment growth, business survival rate and revenue growth to a group of comparable firms that did not receive assistance. The data was grouped by sector, using the North American Industry Classification System (NAICS)18 codes and/or firm size using Average Labour Units (ALUs).19 The crude petroleum and liquid natural gas extraction sectors, the utilities sector and the finance and insurance sector were excluded from the analysis. Larger enterprises with more than 100 ALUs are also excluded. This is to ensure that the data set captures the results from SMEs in the CF service areas.
Analysis of the data demonstrates that CF activities in providing access to capital and business development services were making a difference as CF-assisted firms perform better than the comparable group in terms of employment growth and revenue growth in addition to having a better business survival rate after five years of entry into business. The data also shows that CFs assist firms in a variety of industry sectors. See the rest of this section for details.
Key informants and survey respondents agreed that CFP activities contributed to the ultimate outcomes of the program. Key informants indicated that the CFP also had a greater impact on economic stability, growth and job creation than it contributed to economically sustainable communities or a diversified and competitive local rural economy. Survey findings suggested that the CFP contributed to growth and job creation (88 percent), economic sustainability (79 percent), economic stability (78 percent) and diversification and competitiveness (66 percent). The lower rating for impacts in economically sustainable communities or a diversified and competitive local rural economy may be partially attributable to the fact that these outcomes are long-term.
Size and Concentration of CF-assisted and Comparable Firms
The table below presents the distribution of firms by industry for the reference year (2010) for both CF-assisted firms and the firms from the comparable group. The table demonstrates the diversity of industries that CF-assisted firms are involved in and the relative importance of such industry.
| Industry | Enterprise size (ALU) | CF-assisted Firms | Comparable Firms |
|---|---|---|---|
| Total (All selected NAICS) | All sizes | 100.0% | 100.0% |
| Less than 20 ALU's | 95.4% | 96.6% | |
| 20 to 100 ALU's | 4.6% | 3.4% | |
| Agriculture, Forestry, Fishing and Hunting | All sizes | 7.0% | 11.7% |
| Mining and Oil and Gas | All sizes | 1.6% | 3.1% |
| Construction | All sizes | 10.3% | 16.6% |
| Manufacturing | All sizes | 8.8% | 3.4% |
| Wholesale Trade | All sizes | X | 3.3% |
| Retail Trade | All sizes | 19.1% | 9.6% |
| Transportation and Warehousing | All sizes | 8.1% | 6.3% |
| Information and Cultural Industries | All sizes | 1.8% | 0.7% |
| Real Estate and Rental and Leasing | All sizes | 1.4% | 4.7% |
| Professional, Scientific, and Technical Services | All sizes | X | 13.0% |
| Management of Companies and Enterprises | All sizes | X | 1.8% |
| Administrative and Support, Waste Management and Remediation Services | All sizes | X | 5.2% |
| Arts, Entertainment, and Recreation | All sizes | X | 1.8% |
| Accommodation and Food Services | All sizes | 11.8% | 6.7% |
| Other Services | All sizes | X | 12.2% |
(X) Data suppressed for confidentiality purposes
Source: Business Special Surveys and Technology Statistics Division, Statistics Canada, 2013
Nearly all CF-assisted firms (95.54 percent) were small businesses with less than 20 employees. Comparable firms (96.6 percent) were mostly small business also with less than 20 employees. The table indicates the diversity of industry sectors that CF-assisted firms are involved. Retail trade comprises the largest share of CF-assisted firms (19.1 percent) followed by Accommodation and Food Services (11.8 percent). Construction (10.3 percent), Manufacturing (8.8 percent) and Transportation and Warehousing (8.1 percent) also rank high.
The Herfindahl Index (HI) is a measure of economic diversity as it indicates the extent to which a regional economy is dominated by a number of industries. The index ranges from 0 where several industries have small and equal shares of the market economy to 100, where one industrial sector has perfect market composition (full specialization). Thus, a lower HI measure indicates a highly diversified economy. In 2010, the HI for the group of CF-assisted firms measured 10.47. This was a slight decrease from previous years, where the index measured 10.55 and 10.52 for the years 2008 and 2009 respectively. Over three years, the HI has been trending downwards, demonstrating higher economic diversity amongst CF loan clients.
Employment Growth
The table below shows the compounded annual employment growth rate for CF-assisted firms over a five-year period and compares the results to a group of comparable firms. The following table presents the results of net job creation from 2005–10.
| Industry | Enterprise size (ALU) | CF-assisted Firms | Comparable Firms |
|---|---|---|---|
| Total (All selected NAICS) | All sizes | 8.2% | 3.9% |
| Less than 20 ALU's | 9.5% | 4.2% | |
| 20 to 100 ALU's | 5.4% | 3.0% | |
| Agriculture, Forestry, Fishing and Hunting | All sizes | 8.7% | 1.7% |
| Mining and Oil and Gas | All sizes | X | 9.7% |
| Construction | All sizes | 7.2% | 5.8% |
| Manufacturing | All sizes | 6.3% | 2.2% |
| Wholesale Trade | All sizes | 0.8% | 2.2% |
| Retail Trade | All sizes | 10.3% | 3.7% |
| Transportation and Warehousing | All sizes | 10.1% | 2.9% |
| Information and Cultural Industries | All sizes | 10.5% | 2.4% |
| Real Estate and Rental and Leasing | All sizes | -3.1% | 3.7% |
| Professional, Scientific, and Technical Services | All sizes | 7.6% | 4.4% |
| Management of Companies and Enterprises | All sizes | X | 0.5% |
| Administrative and Support, Waste Management and Remediation Services | All sizes | 7.5% | 5.2% |
| Arts, Entertainment, and Recreation | All sizes | 3.3% | 3.9% |
| Accommodation and Food Services | All sizes | 9.6% | 4.3% |
| Other Services20 | All sizes | 9.8% | 2.4% |
X) Data suppressed for confidentiality purposes
Source: Business Special Surveys and Technology Statistics Division, Statistics Canada, 2014.
The table shows that between 2005 and 2010, CF-assisted firms were much more successful in creating jobs than the group of comparable firms. CF-assisted firms grew by an average of 9.5 percent annually compared to 4.2 percent for non-assisted firms. The figure below shows the industrial sectors where the difference between CF-assisted firms and non-assisted ones was particularly large.
Text Description, Figure 7: Compounded annual employment growth in Western Canada for firms with less than 100 ALUs (2004–09)
Business Survival Rates
Analysis of the data from Statistics Canada indicates that CF-assisted firms were more likely to have survived following the fifth year of entry into business than comparable firms. The business survival rate for CF-assisted firms was 76 percent after five years following start-up compared to 60 percent for comparable firms. The figure below shows the survival rate by year for start-up firms.
Text Description, Figure 8: Year-Over-Year Sales Growth for Firms Across all Industries in Western Canada with less than 100 ALUs (2005–10)

For both groups, total sales rose consistently from 2005 to 2008. However, in 2009 total sales for comparable firms declined by over 13 percent from the previous year, while total sales for CF-assisted firms declined by 0.3 percent. Sales figures for comparable firms grew at approximately the same rate as CF-assisted firms between 2009 and 2010. In general, it appears that CF loan clients were able to withstand shocks to economic activity better than those firms without CF assistance.
Revenue Growth
Analysis of the data from Statistics Canada show that CF-assisted firms had a compounded annual growth rate of 13.8 percent growth rate in sales as compared to a 6.1 percent growth rate in sales for comparable firms. The figure below shows the year over year sales growth for CF-assisted firms and comparable firms from 2005–10. Between 2001 and 2011, CF-assisted firms outperformed comparable firms in terms of sales growth.
Text Description, Figure 9: Year-Over-Year Sales Growth for Firms Across all Industries in Western Canada with less than 100 ALUs (2005–10)

For both groups, total sales rose consistently from 2005 to 2008. However, in 2009 total sales for comparable firms declined by over 13 percent from the previous year, while total sales for CF-assisted firms declined by 0.3 percent. Sales figures for comparable firms grew at approximately the same rate as CF-assisted firms between 2009 and 2010. In general, it appears that CF loan clients were able to withstand shocks to economic activity better than those firms without CF assistance.
Contributing and Constraining Factors to Success
Key informants, survey and case study respondents identified several barriers to the achievement of outcomes. The barriers most commonly identified by key informants include:
- The limited amount of funding and resources available to CFs which impact the capacity of CFs to undertake projects in community economic development;
- The length of the contract between CFs and the department (one-year as opposed to multi-year);
- The limited marketing and outreach conducted by CFs to promote their activities;
- Loan limits set by the CFP; and
- The lack of skilled workers especially in Alberta and Saskatchewan.
In terms of mitigation strategies, WD key informants representatives referred to the CFP revitalization exercise which is expected to promote further uptake of training of CF staff and board members and strengthen the delivery of the CFP. The department has set new targets for value and number of loans approved so that the CFP will have a more measurable impact. As part of the revitalization exercise, the department is working on identifying opportunities to achieve economies of scale (e.g., through sharing of resources) for the efficient delivery of the program. Some CFs mentioned having taken steps to share resources such as using the same loans officer or CF managers.
Performance Measurement
As mentioned earlier, the CFs use The Exceptional Assistant (TEA) software, hosted by CommonGoals to report data on a quarterly and/or annual basis. The client survey required that the CFs generate a list of their clients over the period of the evaluation from this software. Several challenges were encountered as accessing data was cumbersome for the CFs. The Evaluation Team encountered some resistance from some of the CFs as a result.
Data from TEA are reported into a database hosted by CommonGoals for use by the department. Information from this database could not be easily imported to common software programs used by the department for analysis in an aggregate format. The 2008 Evaluation recognised this issue and suggested that the department devise a strategy to resolve system inconsistencies and data definitions.
Based on recommendations from the 2008 Evaluation, the department, together with the other Regional Development Agencies, worked on implementing the national Performance Measurement Strategy (PMS). The work with Statistics Canada on gathering data to address the long-term outcomes of the CFP was implemented as part of the PMS. This is recognised as a best practice by the Evaluation Team.
Key informants noted that reporting was not consistent across CFs due to lack of well-defined definitions and the subjectivity of some of the indicators. Some respondents mentioned that there were too many indicators to allow for effective reporting. With respect to the use of performance information, the survey identified areas CFs commonly use performance information including reporting to partners, clients, funders and the community, as well as in promotional materials (e.g., website, newsletter and proposals presentations).
Some WD representatives interviewed indicated that the department has addressed issues regarding data validity and reliability by streamlining indicators and improved definitions, which have been embedded into TEA. The WD respondents anticipated this will contribute to more timely and useful performance information.
[15] Canada Small Business Financing Program: Updated Analysis of Incrementality. Allan Riding, Canada Works Ltd, 2009
[16] Small Business Access to Financing: Request and Approval Rates, Interest Rates and Collateral Requirements. Published by Industry Canada on July 2013
[17] Credit Condition Trends 2009–2012. Published by Industry Canada in November 2003 http://www.ic.gc.ca/eic/site/061.nsf/eng/02829.html
[18] The NAICS is an industry classification system developed for the North American Free Trade Agreement (NAFTA). It provides common definitions of the industrial structure and a common statistical framework to facilitate the analysis of the economies of the countries of NAFTA.
[19] The ALU is calculated by dividing a firm's annual payroll by the average annual earnings of a representative worker in the same industry.
[20] Includes service industries that support oil and gas extraction.
Performance: Efficiency and Economy
The following section summarizes the findings related to the efficiency, the use of resources and management of investment funds of the CFP. Client satisfaction is also assessed.
Efficiency and Economy of the CFP
Efficiency Measure
WD’s operating costs to deliver the CFP were not available from the department’s financial systems within the evaluation period since they were combined with other program delivery costs. However, starting in 2014–15, the Treasury Board Secretariat requires departments and agencies to adopt efficiency measures as a component of their Performance Measurement Framework. The targets and actual performance for the efficiency measures are to be reported publicly in Departmental Performance Reports starting 2015–16. The department implemented a revised Program Alignment Architecture in 2013–14 with the CFP as a separate sub-program within the program activity of community economic growth. This change will enable the department to track operating expenditures in relationship to the delivery of the CFP, allowing the department to report on the efficiency of delivery of the CFP and compare the cost of delivery to that of other Regional Development Agencies in the future. The department’s efficiency measure for the CFP is stated as “operating costs per $1,000 in Grants and Contributions (Gs&Cs) expended.”
Leveraged Amount
The CFP activities in access to capital, business development services and community economic development activities resulted in leveraged amounts as reported in the CF database and indicated in the table below.
Leveraged Amounts through Various CFP Activities ($ millions)
| Fiscal Year | Amount Leveraged Through Lending Activities | Amount Leveraged from Community Economic Development Projects | Amount Leveraged from Business Development Clients | Total Leveraged Amount |
|---|---|---|---|---|
| 2008–09 | 88.2 | 10.8 | 36.8 | 135.8 |
| 2009–10 | 84.2 | 25.8 | 40.5 | 150.5 |
| 2010–11 | 79.0 | 37.0 | 37.8 | 153.8 |
| 2011–12 | 81.9 | 15.1 | 27.9 | 124.9 |
| 2012–13 | 117.4 | 11.5 | 28.8 | 157.7 |
| Total | 450.7 | 100.2 | 171.8 | 722.7 |
A total of $375.1 million in loans were issued by the CFs over the period of the evaluation. Using the $450.7 million leveraged through lending activities, CF loan clients leveraged $1.2 for every dollar in loans disbursed. This compares to the 2008 Evaluation which reported a leverage amount of $1.3 for every dollar disbursed as loans.
A total of $156.0 million was spent by the department over the period of the evaluation on the CFP. Using the total for all leveraged amounts for all CF activities ($722.7 million), the CFP leveraged $4.6 for every dollar spent by the department.
Efficiency of Resources
CF staff resources have been decreasing over the years (see table below).
| Fiscal Year | Number of Full Time Equivalents | Average staff per CF |
|---|---|---|
| 2008–09 | 608.5 | 6.8 |
| 2009–10 | 597.0 | 6.6 |
| 2010–11 | 548.0 | 6.1 |
| 2011–12 | 528.0 | 5.9 |
| 2012–13 | 493.5 | 5.5 |
Key informants indicated that CFs have experienced resource constraints due to fixed operating allocation levels for several years but are operating in a fairly efficient manner as evidenced by the results achieved. WD key informants suggested that the current revitalization exercise would further improve the cost-effectiveness of CFs through establishment of tiered performance targets for lending, business services and community economic development (CED) and community strategic planning activities, in addition to improvements to governance (including succession planning) and further training for CF staff and board members.
The efficient and effective use of resources by the CFs was also analyzed through the ability of the CFs to meet their program objectives. As indicated in the previous section, analysis of the Statistics Canada business numbers indicated that CF lending and business development services make a difference as CF-assisted firms performed better than the comparable group in terms of employment growth, revenue growth and business survival rate. This is supported qualitatively through the interviews and surveys with respondents indicating that the CFP achieved its immediate, intermediate and long term outcomes.
Management of Investment Funds
The 2008 Evaluation concluded that investment funds are well managed by the CFs, however there was the need to examine the growing proportion of investment funds kept as cash on hand and clarity around loan loss rates.
As part of the CF Revitalization exercise being undertaken by the department, an analysis was undertaken to determine the amount of cash on hand by the CFs. The analysis revealed that individual CFs hold over $80 million in funds that were not invested in active business loans (as at 2013). This represents 28 percent of the value of the investment funds for the CFs.
Many CFs have invested almost all their available funds in active business loans and have been able to demonstrate that demand exists in their region for additional funds. Other CFs have considerably less than 75 percent of funds invested in active business loans (some under 50 percent) and have not increased their lending activity levels or made the extra funds available to other CFs either directly or through provincial investment fund pools.
This is a concern for the department and the ongoing revitalization exercise includes components that will enable the CFP to identify mitigating strategies for the management of investment funds, especially cash on hand. CFs in some regions have already implemented provincial loan pools to make surplus cash on hand available for other CFs to borrow.
The loan loss rates analysis were also analyzed to assess the management of CF investment. The calculation of the loan loss rate was done by dividing the bad debt expense by the value of loans issued as in the table below.
| Fiscal Year | Value of Loans | Bad Debt Expense | Loan Loss Rate |
|---|---|---|---|
| 2008–09 | 77.9 | 4.0 | 5.0% |
| 2009–10 | 79.4 | 6.1 | 8.0% |
| 2010–11 | 71.4 | 6.4 | 9.0% |
| 2011–12 | 67.7 | 6.0 | 9.0% |
| 2012–13 | 78.7 | 6.9 | 9.0% |
| Total | 375.1 | 29.5 | Average/year 8.0% |
The 2008 Evaluation estimated the overall average loan loss rate to be 3.5 percent. The estimated loan loss rate is now 8 percent. This indicates a rise in loan write-offs for the CFs. The increase may be explained by the downturn in the economy, resulting in higher default rates. The department may want to monitor this ratio over time to determine the trend and whether corrective measures are needed.
Key informants and survey respondents were mixed in their views with respect to the management of investment funds. The most common concern was that some CFs were too risk averse, which does not align well with the CFP role as a developmental lender.
Client satisfaction
The overall consensus among survey respondents is that clients and partners were satisfied with CF services, supports and partnerships. The majority of CF partners indicated that they were very satisfied with their partnership with the CF (83 percent). A large majority of CF client survey respondents indicated that they were satisfied with the services and assistance they received from the CF. The majority of both loan and non-loan clients were satisfied with the services they received from their CFs. The most commonly cited reason for client satisfaction was related to the personal business counselling services they received from CF staff. Case study respondents indicated that CF one-on-one business counselling services were helpful to develop their business management skills. The figure below indicates the proportion of clients who were satisfied to a great extent with CFP business services.
Text Description, Figure 10: Proportion of clients who were satisfied to a great extent with CF business services
CF Managers and Chairs were asked about their satisfaction with the department. High levels of satisfaction expressed related to timeliness of responses and interaction with WD Officers (69 percent), availability of WD Officers to respond to concerns (66 percent) and nature of responses (59 percent). However, a lower level of satisfaction was reported for funding levels received from WD (39 percent) and overall satisfaction with WD (44 percent). Case study respondents indicated that they would appreciate the presence of WD Officers at some of their events such as annual general meetings.
Conclusions and Recommendations
Relevance
- The overall conclusion is that there is a relevant ongoing need for the Community Futures Program (CFP) in Western Canada. Evidence from the literature review and from analysis conducted by Industry Canada on SME financing and credit conditions indicate that SMEs face barriers to financing.
- The client survey revealed that the majority of clients who applied to the CF for funding were previously denied funding from other sources.
- Key informants and survey respondents indicated a need for community strategic planning and community economic development (CED) in their regions, however to a lesser extent than for access to capital and business development services. Interview results indicated that respondents were not very familiar with CF CED activities. Given the broad nature of CED, evaluation advisory committee members indicated that reporting on CED indicators is very subjective.
- An assessment of other programs that provide business services indicates that such programs have specific conditions which limit their reach to specific groups of entrepreneurs. The CFs have identified mechanisms such as collaborations, partnerships and referrals to minimize overlap and duplication with other programs and funding sources.
- The 2014–15 Report on Plans and Priorities for the department aligns the CFP with the Government of Canada outcome of “Strong Economic Growth.” The objectives of the CFP align with departmental priorities in Business Productivity and Competitiveness as stated in the department corporate business plans from 2008 to 2012. The objectives of the CFP also aligned with the roles and responsibilities of the department as a federal government economic development agency.
Performance: Achievement of Expected Outcomes
- Using data from Statistics Canada, the department was able to assess the long term outcomes of CF-assisted firms to a comparable group of non-assisted firms. Analysis of the data demonstrated that CF lending activity is making a difference. CFs continued to lend to a more diversified clientele base according to the Herfindahl Index. CF-assisted firms outperformed a comparable group of non-assisted firms in terms of employment growth, survival rate and revenue growth.
- Key informants and survey respondents agreed that the absence of CFs in their community would have a highly negative impact on start-up, survival, growth of new businesses, and community strategic planning and development in their service area.
- With respect to performance, the performance data on outputs, immediate and intermediate outcomes demonstrated the effectiveness of the CFP in achieving its objectives particularly in those outcomes that align with activities related to loans and business development services.
- The evaluation encountered challenges during the data collection exercise particularly on retrieving data from the software used by the CFs and the database used by the department.
Performance: Efficiency and Economy
- Overall, CF loan clients leveraged $1.2 for every dollar in loans disbursed by the CFs. Using the total for all leveraged amounts for all CF activities, the CFP leveraged $4.6 for every dollar spent by the department.
- CFs have experienced reductions in their staff resource over the years but have been efficient and effective in achieving their objectives as evidence by the analysis of the Statistics Canada business numbers. This is supported qualitatively through the interviews and surveys.
- There are some concerns with the management of the investment funds especially with respect to cash on hand.
- CF clients expressed satisfaction with the services they received from their CFs. The most common reason cited for client satisfaction was the one-on-one business counselling services that clients receive from CF staff. CF Managers and Chairs however provided a lower level of satisfaction for WD, in particular in relation to funding levels.
Recommendations
Based on the findings and conclusions drawn from the evaluation, the following recommendations are made to be addressed by the department.
Recommendation 1: The department should clarify CF activities that count as community economic development.
- Clarity in community economic development is needed for better performance reporting in this activity. Interview results indicate that respondents were not very familiar with CF activities that count as community economic development.
- Given the broad nature of community economic development, evaluation advisory committee members indicated that reporting on indicators is very subjective.
Recommendation 2: The department should examine the effectiveness of the CF reporting system to report on outcomes and ensure better integration with departmental systems.
- The Evaluation Team faced challenges in importing data from the CF database into a format that integrates with departmental systems.
- CFs indicated that retrieving information for the client survey was a huge burden on their limited resources.
- This issue regarding the database system was recognized in the 2008 Evaluation but action on it was deferred by the department.
Recommendation 3: The department should continue to work with other Regional Development Agencies on enhancing analysis of long-term outcomes using Statistics Canada data runs. The department may want to explore using this method of assessing long-term outcomes for other departmental programs.
- This evaluation relied to a great extent on the analysis of the Statistics Canada data runs to report on ultimate outcomes for the CFP.
- Date modified: