
Longitudinal Study of WD Clients from 2009-10 to 2019-20
The following report was prepared by Ference & Company Consulting.
View the print-friendly version [PDF link] (297 kB)
Summary Report
Purpose of Study
In advancing its mandate, Western Economic Diversification Canada (WD) has provided over $4 billion dollars from 2009–10 to 2019–20 to support for-profit firms and non-profit organizations in western Canada. Funding through WD’s programming activities assists businesses and non-profit organizations in western Canada to undertake projects that contribute to a diversified western Canadian economy. Contribution agreements with clients enable WD to collect performance information during the period of funding; however, clients do not report to the Department on the performance of their projects after WD funding ends. Therefore, WD commissioned this longitudinal study to gather and analyze longer-term economic performance data of WD-assisted recipients (both for-profit firms and non-profit organizations). Specifically, the focus of the longitudinal study is two major WD programs that provide assistance directly to business and non-profit organizations: notably the Western Innovation Initiative (WINN) which offers assistance to for-profit organizations and the Western Diversification Program (WDP) which supports non-profit entities. This study represents the first longitudinal study conducted by WD. Although WD undertakes regular evaluations of its ongoing programs and routinely collects performance information from its clients to support departmental programming, it does not have robust longitudinal data to inform trend analysis of key economic performance indicators of WD assisted organizations.
Study Methodology
The study methodology consisted of case studies of a representative sample of 50 WINN clients approved in 2014-15 and 2015-16 and 30 WDP clients approved in 2009-10 and 2010-11 to determine the longer-term economic performance of WD assisted recipients. The WINN program offers support to for-profit firms while non-profit organizations are assisted through the WDP program. The performance measurement data collected for all WDP and WINN clients was also reviewed. In addition, a jurisdictional scan was undertaken of longitudinal studies of similar initiatives in Canada and other countries.
WINN Longitudinal Analysis
Since the primary objective of the longitudinal study was to gather and analyze longer-term economic performance data of WINN assisted recipients, the study selected a sample of the first clients that received WINN assistance (i.e., 2014-15 and 2015-16). The funding provided to the 50 sample WINN projects was 30% of the total funding of $148.5 million provided to all 130 WINN projects approved from 2014-15 to 2019-20. Of the 50 sample projects selected, one WINN client declined to participate resulting in a working sample of 49 projects. The sample of 49 WINN projects that received funding in 2014-15 and 2015-16 is representative of the entire 130 WINN projects that received funding from 2014-15 to 2019-20 according to the following factors: province, sector, rural versus urban location, and amount of WD funding per project.
The key economic impacts of the sample of 49 WINN projects are as follows:
WINN projects have started to become a major source of revenue for many WINN clients. The incremental revenues resulting from sample WINN projects have accelerated over the six-year time period from $5.7 million in 2014 to $165.1 million in 2019. About $148 million or 90% of the total incremental revenues of $165.1 million emanate from the initial project undertaken by sample clients while the remaining incremental revenues are due to the second project undertaken by 9 sample WINN clients. These nine secondary projects have only recently started to have an impact and will require more time to determine their long-term impact.
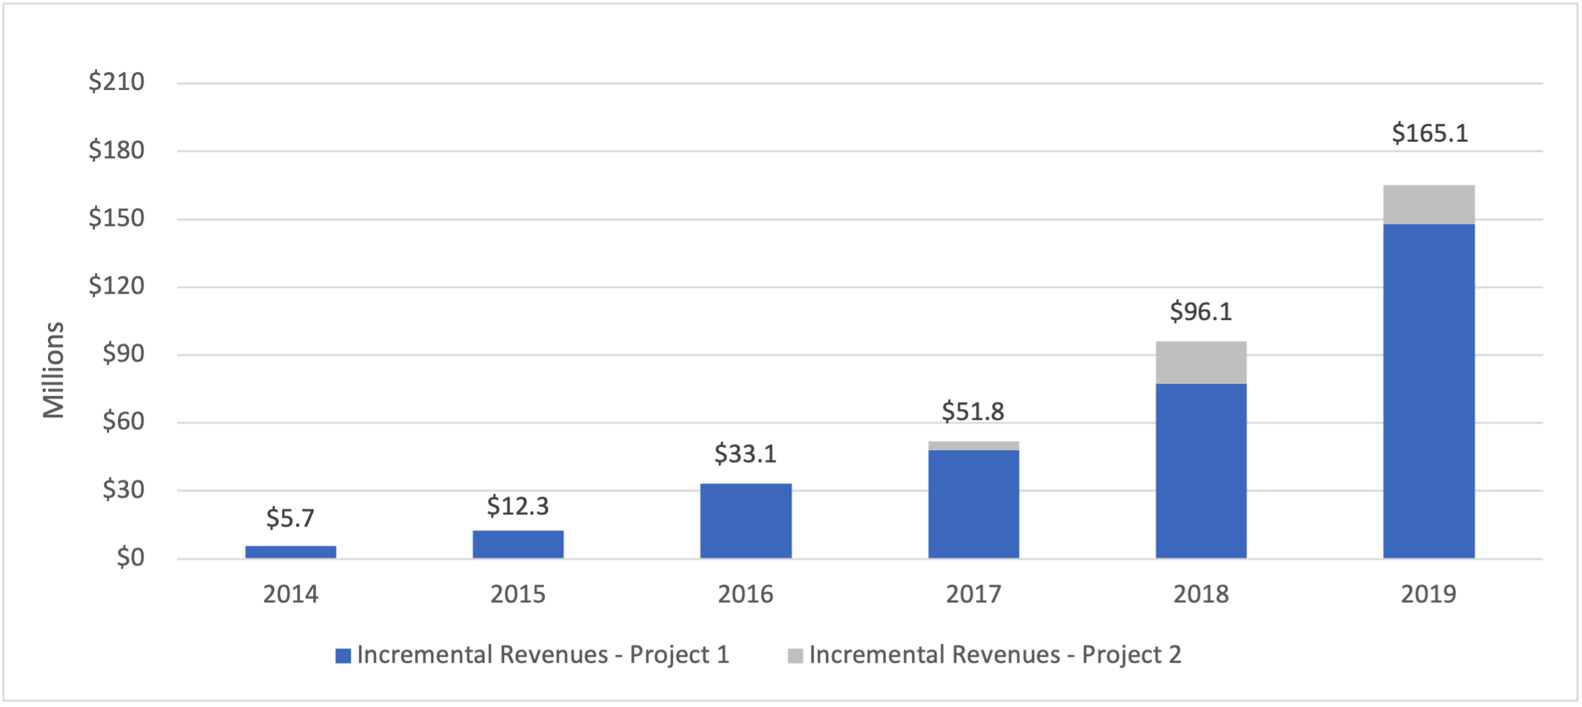
Text version: Incremental Revenues of WINN Projects (n=48) of Sample WINN Clients (n=42)
The figure show the incremental revenues of sample WINN projects undertaken by WINN clients from 2014 to 2019. Data include initial projects undertaken and second projects undertaken by some WINN clients.
- 2014 revenue was $5.7 million
- 2015 revenue was $12.3 million
- 2016 revenue was $33.1 million
- 2017 revenue was $51.8 million
- 2018 revenue was $96.1 million
- 2019 revenue was $165.1 million
About 93% of the incremental revenues resulting from WINN projects are export rather than domestic sales for sample WINN projects. Several WINN clients indicated that they have enjoyed commercial success in foreign markets before they attempted to penetrate the Canadian market.
The cumulative revenues of all 130 WINN clients approved from 2014-15 to 2019-20 are estimated to be $961 million over a 6-year time frame since funding was provided which equates to average cumulative revenues of $6.46 per dollar of WINN funding. Of the $961 million in cumulative revenues, 93% or $893.2 million are estimated to be export sales revenues of all WINN projects while the remaining $68 million are estimated to be domestic sales. Some reasons provided by key informant interviewees for lack of significant domestic sales included the limited size of the market in Canada and the reluctance of federal and provincial governments in Canada to purchase new technological products and services from Canadian suppliers until they have been proven in foreign markets.
Long-term employment created by sample WINN clients has increased steadily from 124.5 FTEs in 2014 to 854.1 FTEs in 2019. Most of this incremental employment resulted from the initial WINN project because the employment created by the second WINN project undertaken by some sample WINN clients has only started to increase significantly in the last two years and more time is required to accurately determine the employment impact of these second WINN projects. The estimated long-term employment created by all 130 WINN projects approved from 2014-15 to 2019-20 is estimated to be 1,905 FTEs over a six-year time frame. This equates to an average of $78,039 of WINN funding per FTE created. The incremental employment of Highly Qualified Personnel (HQP) created by all 130 WINN projects is estimated to be 1,715 FTEs while 190 FTEs of other long-term employment has also been created.
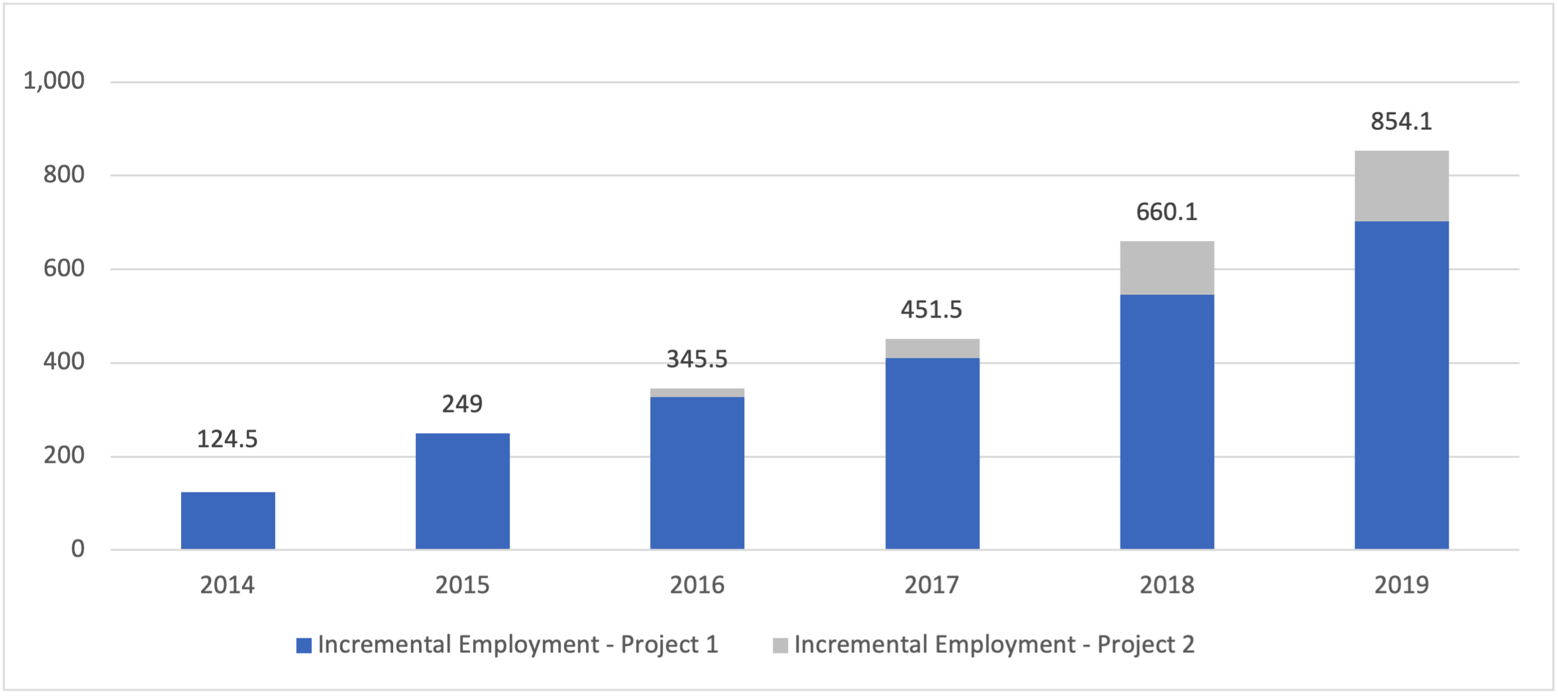
Text version: Incremental Employment of Sample WINN Projects (n=53) of Sample WINN Clients (n=44)
The figure show the incremental employment of sample WINN projects undertaken by WINN clients from 2014 to 2019. Data include initial projects undertaken and second projects undertaken by some WINN clients.
- 2014 employment was 124.5 FTEs
- 2015 employment was 249 FTEs
- 2016 employment was 345.5 FTEs
- 2017 employment was 451.5 FTEs
- 2018 employment was 660.1 FTEs
- 2019 employment was 854.1 FTEs
The total public and private investment raised by sample WINN clients for which data was available is estimated to be $1.46 billion over a six-year time frame. This equates to leverage of $27.41 in additional funding for every dollar of WINN funding. The amount of private investment raised was $873 million which is greater than the amount of incremental public funding ($539 million). About 78% of all funds were raised after the WINN projects were completed while the remaining funds were raised during the implementation of the WINN projects. Of the companies who secured additional investment, a significant number attested that WD funding and backing both raised their credibility when pitching to potential investors and helped them leverage additional funding and new strategic partnerships.
The total incremental public and private investment raised by all 130 WINN clients over a six-year time frame is estimated to be $4.1 billion. Of this total, the amount of additional private investment is estimated to be $2.4 billion while the balance ($1.6 billion) consists of additional public investment.

*Note: Figure does not include $53.5 million in company matching funds committed at the time of application
Text version: Additional Investment Raised by Sample WINN Clients (n=42)
The figure show the additional public and private investments raised by 42 WINN clients
- $233.4 million private investment raised during project funding
- $639.9 million in private investment raised after the end of project funding
- $29.7 million in public investment raised during project funding
- $510.3 million in public funding raised after the end of project funding
Degree of Success of Sample WINN Projects
This study analysed the degree of success of the sample WINN projects utilizing the following seven criteria: whether the WINN project has been commercialized; incremental revenues earned; additional employment generated; demonstrated ability of the company to raise additional funding for the WINN project; overall company profitability; amount of working capital available; and ability to repay WINN funding. These criteria were developed based on a review of criteria used in similar analyses and the previous experience of Ference & Company in assessing the performance of SMEs. Based on these criteria, 28 (57%) of the sample of 49 WINN projects have been categorized as “s“uccessful”, 11 (23%) as “somewhat successful” and 10 (20%) have been rated as “unsuccessful”.
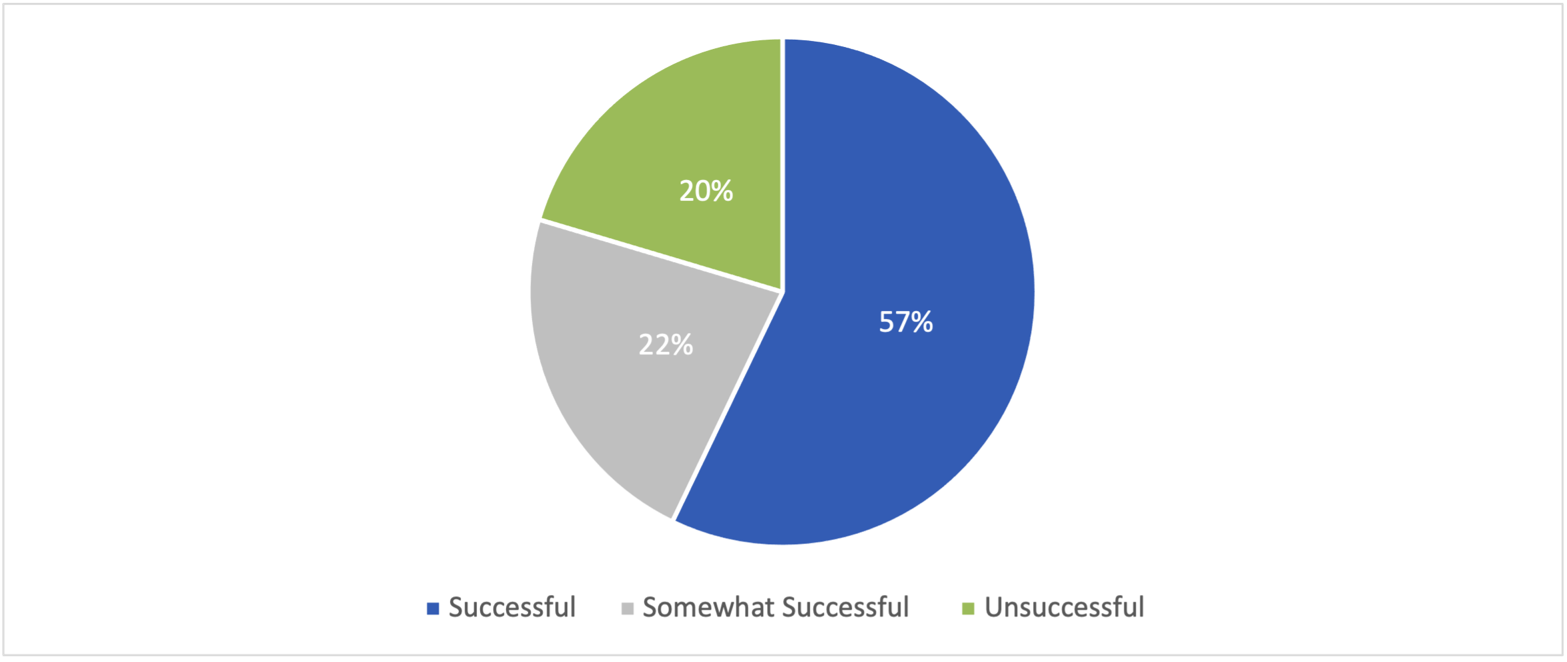
Text version: Degree of Success of Sample WINN Projects (n=49)
The figure is a pie chart that shows the degree of success of 49 WINN projects.
- 57% showed as successful
- 22% showed as somewhat successful
- 20% showed as unsuccessful
The incremental revenues for companies categorized as “somewhat successful” shows that many of these firms have yet to generate significant project revenues. While it is too early to determine whether these companies will eventually generate significant revenues, it is possible that a portion of these “somewhat successful” companies may ultimately be re-categorized as “unsuccessful”.
For British Columbia (BC), Saskatchewan and Manitoba, about three quarters of the sample WINN clients in each of these provinces had a “successful” WINN project. However, the proportion of WINN clients in Alberta with a “successful” WINN project is only 30%; this is primarily due to a downturn in the oil and gas sector.
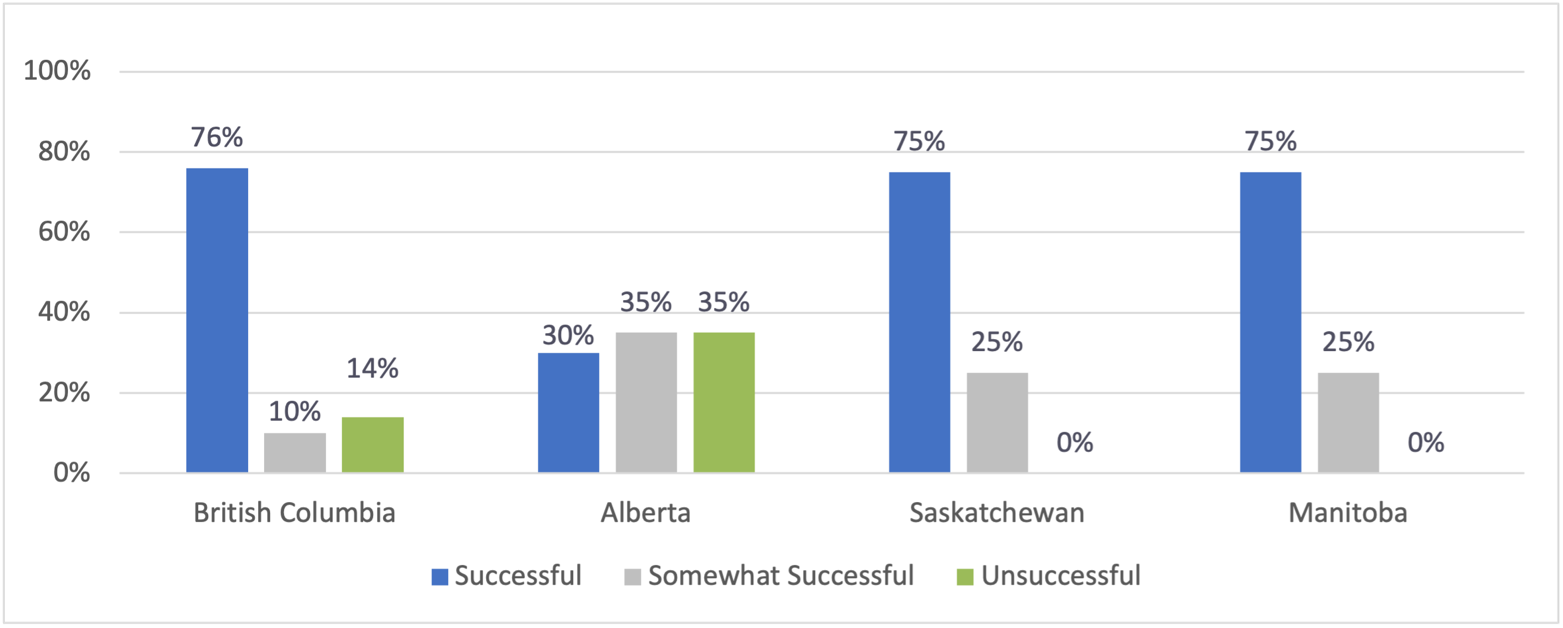
Text version: Degree of Success of WINN Projects by Province (n=49)
The figure show the degree of success of 49 WINN projects broken down by province.
- 76% of projects from British Columbia showed as successful
- 10% of projects from British Columbia showed as somewhat successful
- 14% of projects from British Columbia showed as unsuccessful
- 30% of projects from Alberta showed as successful
- 35% of projects from Alberta showed as somewhat successful
- 35% of projects from Alberta showed as unsuccessful
- 75% of projects from Saskatchewan showed as successful
- 25% of projects from Saskatchewan showed as somewhat successful
- 0% of projects from Saskatchewan showed as unsuccessful
- 75% of projects from Manitoba showed as successful
- 25% of projects from Manitoba showed as somewhat successful
- 0% of projects from Manitoba showed as unsuccessful
The proportion of clients with successful WINN projects is highest in the clean technology/clean energy sector (67%), digital economy/new media/ICT sector (64%), and the health and life sciences sector (55%).
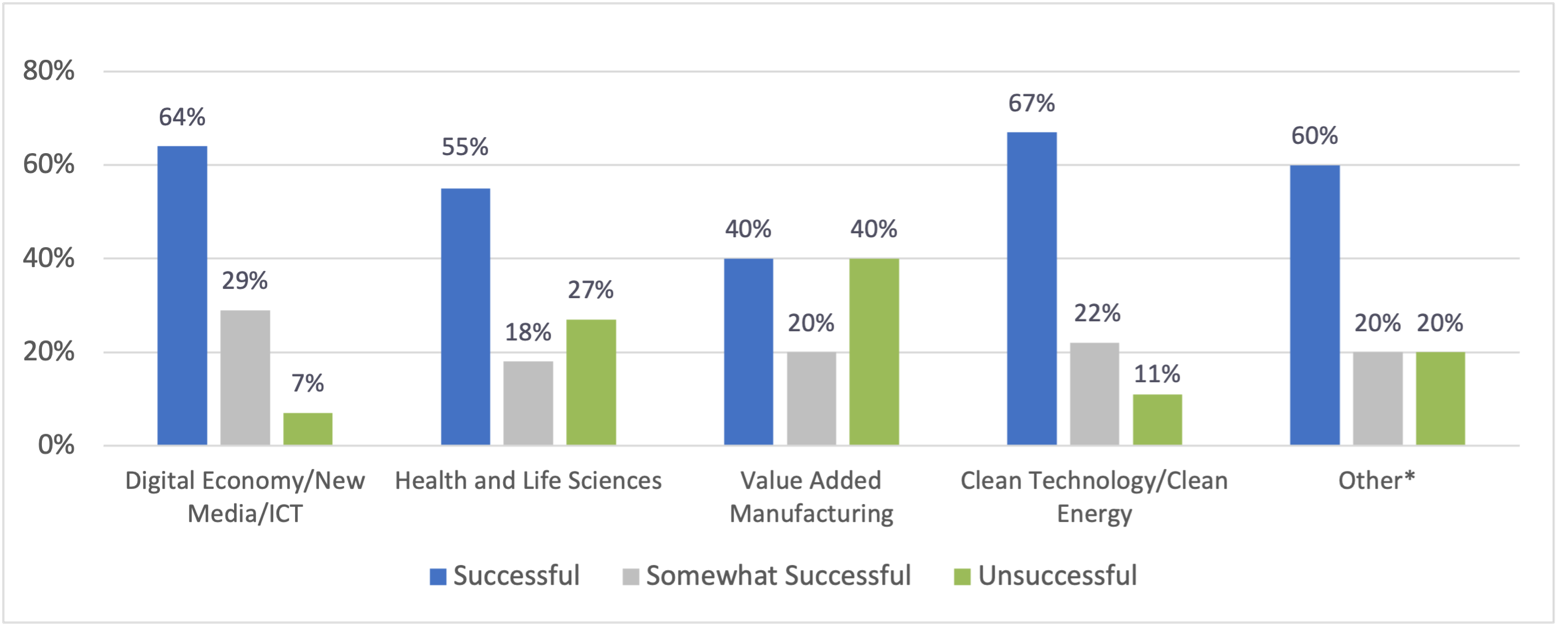
*Other includes aerospace, defense and marine, nanotechnology, value added natural resources and other sectors.
Text version: Degree of Success of WINN Projects by Sector (n=49)
The figure show the degree of success of 49 WINN projects broken down by sector.
- 64% of projects in Digital Economy/New Media/ICT showed as successful
- 29% of projects in Digital Economy/New Media/ICT showed as somewhat successful
- 7% of projects in Digital Economy/New Media/ICT showed as unsuccessful
- 55% of projects in Health and Life Sciences showed as successful
- 18% of projects in Health and Life Sciences showed as somewhat successful
- 27% of projects in Health and life sciences showed as unsuccessful
- 40% of projects in Value Added Manufacturing showed as successful
- 20% of projects in Value Added Manufacturing showed as somewhat successful
- 40% of projects in Value Added Manufacturing showed as unsuccessful
- 67% of projects in Clean Technology/Clean Energy showed as successful
- 22% of projects in Clean Technology/Clean Energy showed as somewhat successful
- 11% of projects in Clean Technology/Clean Energy showed as unsuccessful
- 60% of projects in Other category showed as successful
- 20% of projects in Other category showed as somewhat successful
- 22% of projects in Other category showed as unsuccessful
A separate analysis of 13 WINN clients who defaulted or were likely to default on their WINN repayments was conducted. The most frequent reason for lack of success of the clients that defaulted or were likely to default is limited revenues due to insufficient market research and testing prior to proceeding with the project (77%). The second most frequent reason (31%) is industry downturn (e.g., oil and gas sector) while the next two most frequent reasons are poor financial condition at the time of application (23%), and major technical challenges that delayed commercialization (23%).
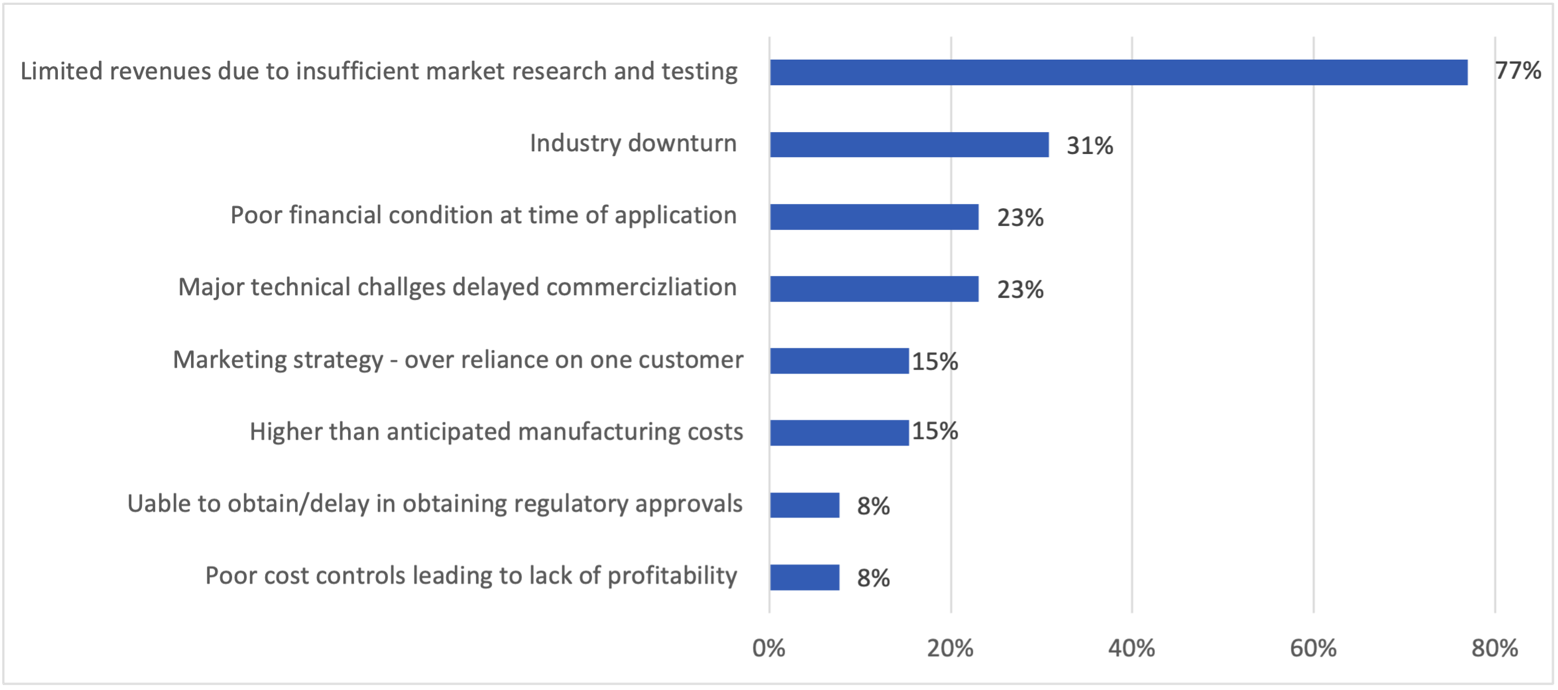
Text version: Reasons for Default of Companies Transferred to Collections or Deemed Unsuccessful (n=13)
The figure show the reasons given by 13 WINN clients who defaulted or were likely to default on their WINN repayments
- Limited revenues due to insufficient market research and testing – 77%
- Industry downturn – 31%
- Poor financial condition at time of application – 23%
- Major technical challenges delayed commercialization – 23%
- Marketing strategy – over reliance on one customer – 15%
- Higher than anticipated manufacturing costs – 15%
- Unable to obtain/delay in obtaining regulatory approvals – 8%
- Poor cost controls leading to lack of profitability – 8%
Assessment of Existing Predictors of Success
All WINN funding applications are evaluated by WD across a number of metrics including the following: market assessment, financial assessment, management assessment, technology assessment and a risk assessment. Each individual assessment receives a rating and these assessments are then combined to produce an overall assessment of the proposed WINN project. A comparison was undertaken of the degree of project success as determined by this longitudinal study with the project assessments conducted by WD. The following paragraphs contain suggestions to enhance the existing predictors of success for WINN projects as well as other programs that provide funding to for-profit companies.
- The use of the National Research Council of Canada’s Industrial Research Assistance Program (IRAP) staff to assess the technology aspects of a WINN application is useful.
- The technology assessment ratings conducted by IRAP on behalf of WD align somewhat well with the degree of success achieved by sample WINN clients. As an illustration, 54% of successful projects and 55% of somewhat successful projects received a “very strong” technology assessment rating compared to only 10% of unsuccessful projects.
- There appear to exist some opportunities to enhance the accuracy and usefulness of IRAP technology assessments because major technical challenges were a key factor for lack of success of 23% of the default and unsuccessful clients.
- The longitudinal analysis indicates that greater effort is required to ensure that the revenue projections/targets in WINN applications are more realistic to allow for a more accurate assessment of whether a project should receive WINN funding and to have more realistic revenues targets as a performance measure.
- The market assessments conducted by WD do not align with the degree of success of WINN clients. As an illustration, about 90% of unsuccessful WINN clients received a “very strong” market assessment rating which is considerably higher than the proportion of successful (71%) and somewhat successful (64%) clients that received a “very strong” market assessment rating. The analysis of default and unsuccessful clients demonstrates that the most frequent reason (77%) for lack of success of default and unsuccessful projects is limited revenues due to insufficient market research and testing prior to proceeding with the project.
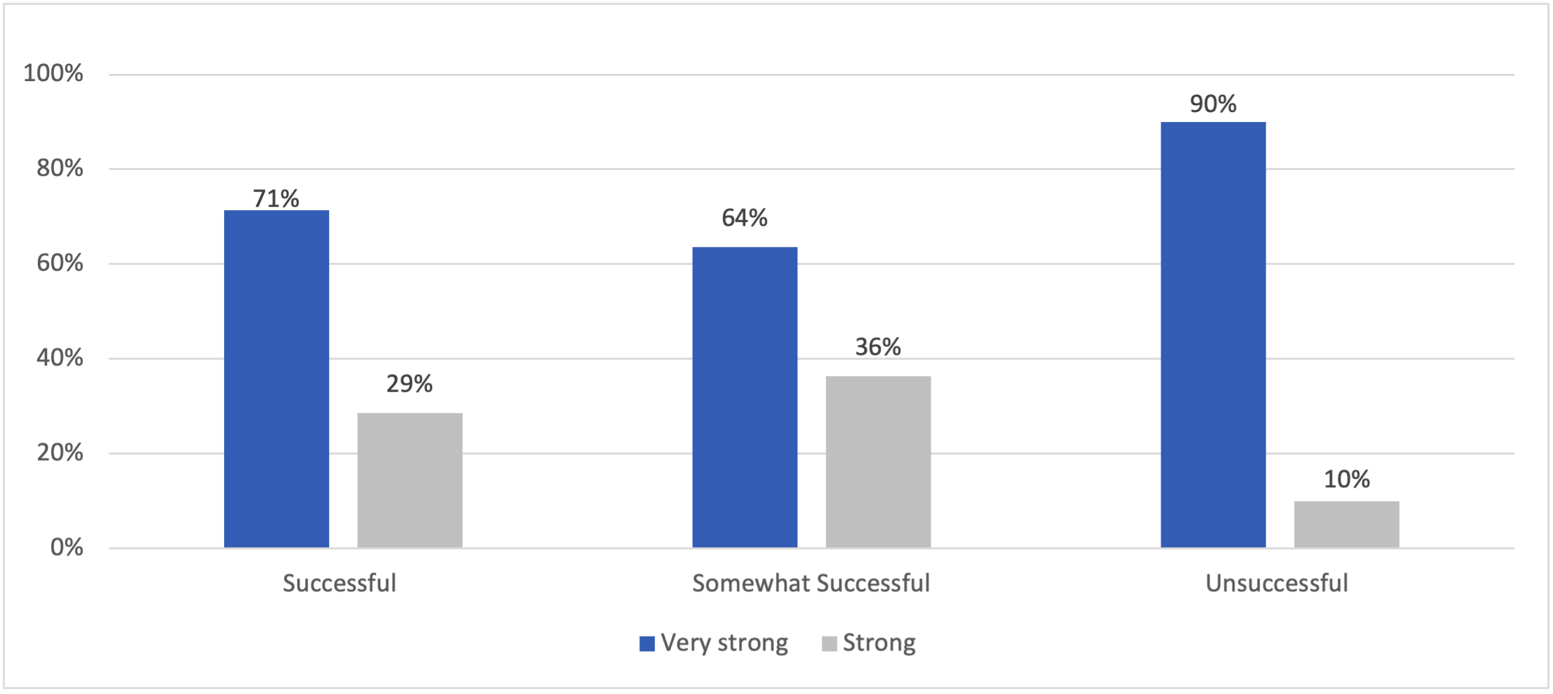
*Note: No fair rating for any WINN project in the sample
Text version: WD Market Assessment Rating by Degree of Success of Sample WINN Projects (n=49)
The figure show the degree of market assessment rating of 49 WINN projects given as part of WD due diligence process on projects.
- 71% of successful projects were given a very strong rating
- 29% of successful projects were given a strong rating
- 64% of somewhat successful projects were given a very strong rating
- 36% of somewhat successful projects were given a strong rating
- 90% of unsuccessful projects were given a very strong rating
- 10% of unsuccessful projects were given a strong rating
- Some options that should be considered to improve the accuracy of the market assessments of WINN funding applications include the following:
- Ensure that applicants undertake primary market research and market testing rather than just secondary market research before an application is considered;
- Provide separate funding to potential applicants to conduct primary market research and market testing before they submit an application for capital funding; and
- Engage independent marketing consultants to review all WINN applications from a market perspective in much the same manner as IRAP is engaged to conduct technology assessments.
- There exist opportunities to increase the accuracy of the financial assessments of WINN project applications because poor financial condition at the time of application was a key factor for lack of success for 23% of the default and unsuccessful clients. It is critical that the financial assessments include the following:
- The level of profitability of the company and the accumulated deficit at the time of application;
- Amount of working capital available at time of application and whether it will be sufficient to cover any projected losses until profitability is achieved; and
- Ability of the company to raise additional capital to offset any losses until profitability is achieved.
- The management assessment ratings of WINN applications are not that useful as a predictor of success because almost all WD clients received a “very strong” rating including unsuccessful WINN clients. None of the sample WINN clients received a “fair” assessment rating. In addition to assessing the experience of management, the management assessment should determine whether the WINN application takes into account risk factors such as over-reliance on one customer or sector, likelihood of obtaining regulatory approvals and accuracy of estimated manufacturing and other major operating costs.
Assessment of WINN Clients Compared to Enterprises in the General Population
Statistics Canada carried out additional analysis to study the impact of the Western Innovation Initiative (WINN) program as part of the longitudinal study. 117 WINN recipients were compared to similar sized enterprises in Western Canada (control group) with similar characteristics (e.g., financial) that did not receive funding. These comparisons were done using growth rates, and were complemented with estimates of differences.
The results showed that that the WINN program has positive effects on multiple key financial variables for enterprises that receive funding both in the short and medium term. This included better performance for WINN recipients in employment, assets, revenue, annual pay, sales of goods and services, and productivity.
In the short term, the results found that that the WINN program could reduce the growth of debt of enterprises that receive funding and increase the salaries and wages of their employees. In the 2015 study year, the growth rate of salaries and wages one year after approval for recipients was significantly higher than the control group by approximately 96% and the growth rate of debt ratio one year after approval for recipients was significantly lower than the group by approximately 34%.
The WINN program also provided measurable, positive medium-term effects on the revenue and sales of goods and services of its recipients. For the 2014 study year the growth rate of revenue for the WINN recipients, three years after approval, was more than 113% higher than the control group. Additionally, growth rates of sales of goods and services were significantly higher for WINN recipients, three years after approval, by approximately 176%, 38%, and 166% in the 2014, 2015, and 2016 study years, respectively.
The estimate of differences complemented the results seen in the growth rates, and found that the WINN program increased the revenue of the enterprises that receive funding. In the short-term recipients had a higher revenue than the control group by about $1.6 million and $1.4 million in the 2016 and 2018 study years, respectively. In the medium term the estimate of sales of goods and services for the recipients was higher than the control group by approximately $3 million dollars for the 2015 study year.
Framework for Future Longitudinal Analyses of For-Profit Organizations
A jurisdictional scan of similar initiatives was conducted to assess best practices and lessons learned by other jurisdictions. The main findings of the jurisdictional scan are as follows:
- An extensive review of federal and provincial government programs providing financial assistance to for-profit and non-profit organizations resulted in the identification of very few longitudinal impact analyses being conducted.
- Most of the economic impact studies of government financial assistance provided to for-profit firms employed short time frames, typically from 3 to 5 years after funding was provided. An exception is the CED study that used a StatsCan comparative analysis of financial assistance provided to firms with those not receiving assistance over a period up to 10 years after funding was received.
- The indicators most frequently used in the economic impact studies of government assistance to for-profit firms are an increase in revenues and employment.
The following paragraphs describe a methodology for future longitudinal analysis of funding provided to for-profit organizations.
- The 6-year time frame of the current longitudinal analyses was not long enough and should be extended to 10 years to determine the long-term impact of WD funding on WINN clients because both revenues and employment increased significantly in the last few years of analysis.
- Similar longitudinal analyses should be conducted every three to five years to provide a longer term (at least 10 years) and more accurate perspective of the impact of WD assistance on for-profit organizations. Future longitudinal analyses should include some of the WINN projects included in this study to provide an even longer-term perspective as well as assistance provided more recently by WD to other businesses to assess if the results are similar to that obtained from this longitudinal analysis.
- A methodology similar to the current longitudinal analysis should be employed to conduct future longitudinal studies of funding to for-profit organizations.
WDP Longitudinal Analysis
Since the primary objective of the longitudinal study was to gather and analyze longer-term economic performance data of WDP assisted recipients, the study selected a sample of the first clients that received WDP assistance (i.e. 2009–10 to 2010–11).The funding provided to the 30 sample WDP projects was 35% of the total funding of $85.7 million provided to 80 WDP projects approved in 2009-10 and 2010-11 and 5% of the total funding of $627.9 million provided to all 539 WDP projects approved from 2009-10 to 2019-20. Of the 30 sample projects selected, two WDP clients declined to participate resulting in a working sample of 28 projects. The types of organizations that conducted these 28 WDP projects consisted of 10 universities, 9 innovation centres, 7 economic development organizations and 2 other organizations. Of the 30 organizations, 13% of them serve under-represented peoples which for the purposes of this report includes women, Indigenous Peoples, members of racialized minorities, people with disabilities and LGBTQ2+ individuals.
Significant data limitations were experienced conducting the longitudinal analysis of WDP projects including the following:
- The type of performance data collected by WD varies considerably for the sample WDP projects conducted in 2009-10 and 2010-11 making it difficult to summarize the data to determine the overall impact of WDP projects. While this was the case in 2009-10 and 2010-11, the performance measures have been further refined and consolidated over the years.
- Performance data was collected by WD only for the duration of the project resulting in no performance data after completion of the project.
- Many of the sample WDP project funding recipients did not continue to collect data on the performance indicators once the project was completed.
- Progress reports or final reports for many of the sample WDP projects conducted in 2009-10 and 2010-11 were completed but not readily available as the record keeping at that time was primarily in paper files.
- To mitigate the lack of data on performance measures due to the above factors, the interviews conducted with WDP funding recipients were designed to collect information on the project performance measures both during and after project completion. This exercise was somewhat successful as it was limited by the data available from funding recipient’s information systems and their knowledge of projects undertaken about 10 years ago.
The key economic impacts of the sample of 28 WDP projects are as follows:
- Thirty-six (36) companies were created, expanded or maintained by 10 sample WDP projects that were able to provide data both during and after project completion.
- The 21 sample WDP projects that were able to provide data resulted in the creation of 222 FTEs of employment. About 68% or 151.5 positions consisted of HQP employment. Nearly three quarters of all positions created by WDP sample projects were generated after the WDP project concluded. Commercialization centres accounted for 84% of HQP employment while universities were responsible for the remaining 16% of HQP employment created.
- The number of people trained by sample WDP projects included the following:
- 1,095 HQP personnel – about two thirds of this training was undertaken by universities while the balance of training was primarily provided by commercialization centres;
- 3,851 students – more than 80% of this student training was undertaken by universities while the balance of training was provided by commercialization centres; and
- 2,409 other individuals - economic development agencies account for the majority (71%) of other individuals trained while universities and innovation centres provided the balance of the training.
- The incremental investment raised by 25 sample WDP projects was $306.9 million of which 72% consisted of public investments and 28% was private investments. Most (87%) of this incremental investment was raised after the sample WDP projects were completed.
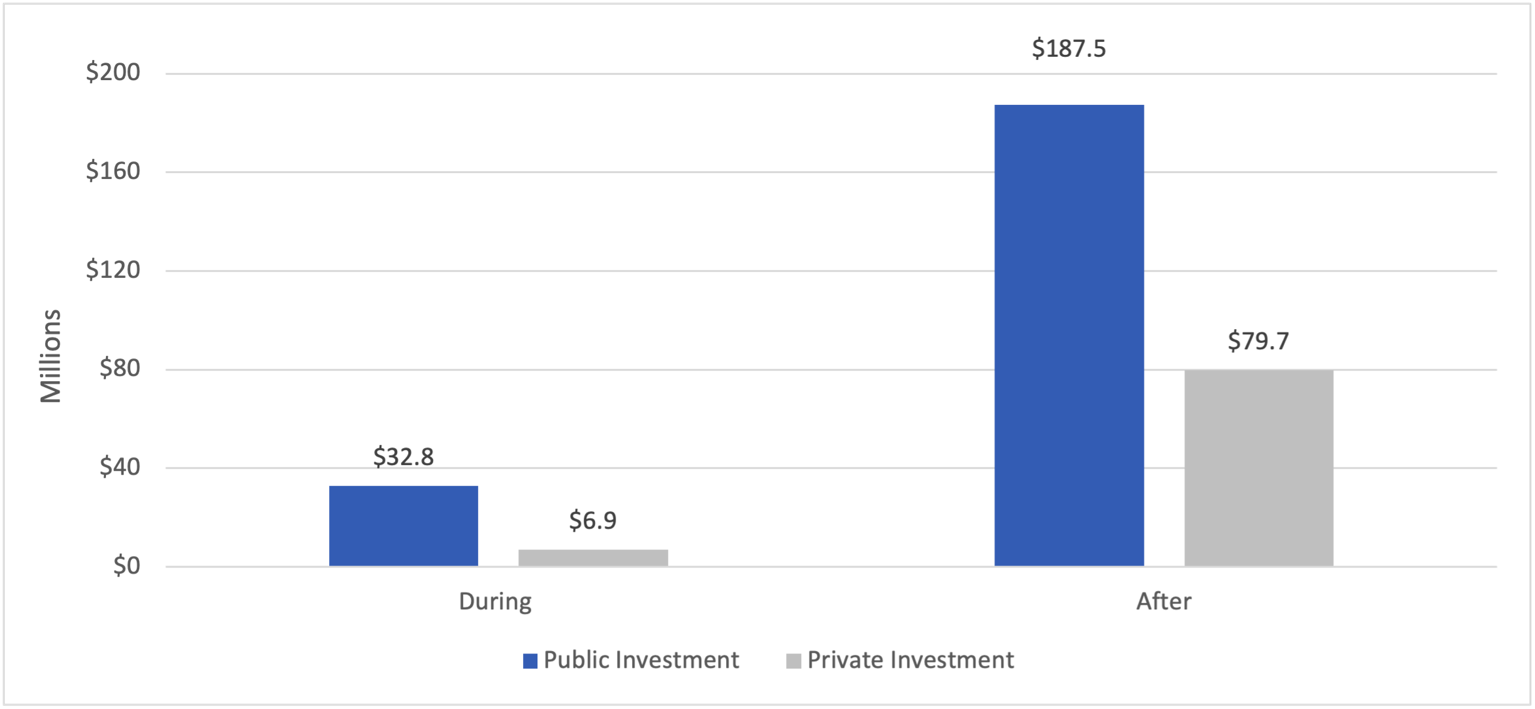
Text version: Additional Public and Private Investment Raised by Sample WDP Projects (n=25)
The figure show the additional public and private investments raised by 25 WDP clients.
- $32.2 million in public investment raised during project funding
- $6.9 million private investment raised during project funding
- $187.5 million in public funding raised after the end of project funding
- $79.7 million in private investment raised after the end of project funding
- A total of 720 products, services and technologies were commercialized by 17 sample WDP projects. Most (97%) of this commercialization was undertaken by innovation centres after the WDP projects concluded while the balance was undertaken by universities also after project completion.
- The proportion of sample WDP projects that are still in operation undertaken by innovation centres and universities is 77% and 70%, respectively, which is considerably higher than for economic development organizations (29%).
- Over one half of sample WDP projects generate revenues (e.g., fees for services). The proportion of sample WDP projects that generate revenues is higher for innovation centres (77%) compared to universities (44%) and economic development organizations (28%).
Framework for Future Longitudinal Analyses of Non-Profit Organizations
Due to the small sample size and the lack of data available from most WDP clients regarding the impacts of WDP projects after they have been completed, it was not possible to use the results of this longitudinal analysis to accurately estimate the long-term impacts of all WDP projects. The longitudinal analysis of a sample of 28 WDP projects, however, does indicate that the types of impacts obtained during the project continue and, in most cases, result in even greater impacts than that achieved during the project. The long-term impacts of WDP projects include the following:
- Creation, expansion and maintenance of businesses;
- Creation of HQP and other employment;
- Training of HQP, students and other individuals;
- Commercialization of products, services and technologies; and
- Raising of additional public and private investment.
The availability of appropriate and up-to-date performance measurement data is critical to conducting efficient and effective longitudinal analyses. The following paragraphs contain our recommendations regarding the most appropriate performance measures that should be employed to conduct future longitudinal analysis of WDP or similar initiatives that provided funding to non-profit organizations.
- Effort should be made assess the potential to further refine the number of performance indicators used for WDP projects and to have more consistent performance indicators to be able to summarize the overall impacts of WDP projects. Based on the results of the longitudinal analysis, a partial list of the performance indicators that should be used to determine the short and long-term impacts of WDP projects are as follows:
- Number of businesses created, expanded and maintained during and after the project;
- HQP and other employment created during and after the project;
- Number of HQP, students and other individuals trained during and after the project;
- Number of products, services and technologies commercialized during and after the project; and
- Additional public and private investment raised during and after the project.
- To be able to assess the long-term impacts of WDP projects, data on the agreed upon performance indicators should be collected for at least five years but not longer than 10 years after the project has been completed.
The following paragraphs describe a methodology for future longitudinal analysis of funding provided to not-for-profit organizations.
- The sample size for the longitudinal analysis should be large enough to allow for statistically significant findings and the sample should be representative of the population of funded projects.
- A key source of data for longitudinal analysis should be information collected on performance indicators during the project as well as five years after completion of the project. This performance data should be supplemented with telephone interviews with recipients of a sample of projects funded by WD to verify the performance data and obtain additional information not provided by the performance data.
- To provide sufficient data for an economic model to determine the long-term impact of WDP projects or similar programs involving non-profit organizations, the timing of the longitudinal analysis should be a minimum of five years after project completion.
Authors
Ference & Company Consulting
550–75 West Georgia St
Vancouver BC V6B 4M9
Telephone: 604-688-2424
Email: ference@shaw.ca
Website: www.ferenceandco.com
- Date modified: