
Western Economic Diversification Canada’s Quarterly Financial Report for the quarter ended December 31, 2020
View the print-friendly version: PDF (235 kB)
Statement Outlining Results, Risks and Significant Changes in Operations, Personnel and Programs
Introduction
This quarterly financial report should be read in conjunction with the Main Estimates, Supplementary Estimates (A), and Supplementary Estimates (B). It has been prepared by management as required by section 65.1 of the Financial Administration Act (FAA) and in the form and manner prescribed by the Treasury Board. This quarterly report has not been subject to an external audit or review.
Authority, Mandate and Program Activities
Western Economic Diversification Canada (WD) is mandated to “promote the development and diversification of the economy of Western Canada and to advance the interests of the West in national economic policy, program and project development and implementation.”
The Departmental Plan and Main Estimates provide further information on WD’s authority, mandate and program activities.
Basis of Presentation
This quarterly report has been prepared by management using an expenditure basis of accounting. The accompanying Statement of Authorities includes the department’s spending authorities granted by Parliament and those used by the department, consistent with the Main Estimates and Supplementary Estimates (A) for the 2020-2021 fiscal year. This quarterly report has been prepared using a special purpose financial reporting framework designed to meet financial information needs with respect to the use of spending authorities.
The authority of Parliament is required before money can be spent by the Government. Approvals are given in the form of annually approved limits through appropriation acts, or through legislation in the form of statutory spending authority for specific purposes.
The Department uses the full accrual method of accounting to prepare and present its annual departmental financial statements that are part of the departmental results reporting process. However, the spending authorities voted by Parliament remain on an expenditure basis.
Financial Structure
WD manages its expenditures under two votes:
- Vote 1 – Net operating expenditures include salary, and other operating costs (e.g., transportation and communications; professional and special services).
- Vote 5 – Grants and contributions include all transfer payments.
Budgetary statutory authorities represent payments made under legislation approved by Parliament, and include:
- Authorization received from the Minister of Health and Minister of Finance to issue transfer payments pursuant to the Public Health Events of National Concern Payments Act.
- Government of Canada’s share of employee benefit plans and other minor items.
Highlights of Fiscal Quarter and Fiscal Year-to-Date (YTD) Results
The following section highlights significant changes to fiscal quarter results as of December 31, 2020.
Statement of Authorities: Vote 1 – Net Operating Expenditures
Total authorities available for use for fiscal year 2020-2021 are $52.1 million, a net increase of $7.6 million, or 17%, compared to the $44.5 million for 2019-2020. The net increase is explained by:
- $7.2 million increase in funding for the delivery of the Regional Relief and Recovery Fund;
- $1.0 million increase in funding for the Canada Coal Transition Initiative;
- $0.4 million net increase in the operating budget carry forward and other minor adjustments; and
- $1.0 million decrease from completing the development of a water and soil protection strategy in the prairies.
Total authorities used has increased to $32.1 million for the quarter ended December 31, 2020, compared to $29.6 million at December 31, 2019. The increase of $2.5 million or 8% is explained by salary increases in 2020 to deliver WD’s transfer payment programs including the Regional Relief and Recovery Fund. This is offset by reductions in other operating costs such as travel, rentals, equipment, repairs and timing differences in ongoing expense accounts.
Graph 1 illustrates total authorities available for use for the fiscal year, and authorities used at quarter-end.
(in thousands of dollars)
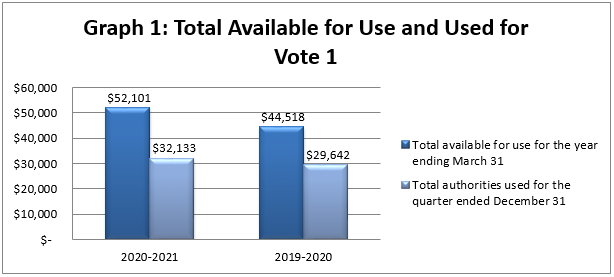
Total Available for Use and Used for Vote 1 (in thousands of dollars)
This bar graph breaks down total authorities available for use for fiscal year 2020-2021 and the authorities used at quarter end and then compares them to fiscal year 2019-2020.
2020-2021
- $52,101 represents total available for use for the year ending March 31
- $32,133 represents year-to-date authorities used for the quarter ending December 31
2019-2020
- $44,518 represents total available for use for the year ending March 31
- $29,642 represents year-to-date authorities used for the quarter ending December 31
Statement of Authorities: Vote 5 – Grants and Contributions
Total authorities available for use for fiscal year 2020-2021 are $347.2 million, a net increase of $85.6 million, or 33%, compared to the $261.6 million for 2019-2020. The net increase is explained by:
- $63.1 million net increase for the Regional Relief and Recovery fund;
- $24.2 million increase to fund the Canada Coal Transition Initiative;
- $22.5 million net increase for LNG Haisla Bridge;
- $12.0 million increase to fund research and innovation in response to COVID-19;
- $10.0 million increase for receipts from Repayable Contributions;
- $8.0 million increase to fund national medical science, research and development;
- $5.6 million increase for launching federal strategy on Jobs and Tourism;
- $5.0 million increase for the Women Entrepreneurship Strategy Ecosystem Funding in response to COVID-19;
- $1.5 million net increase to fund inter-city bus service in Western Canada;
- $25.0 million decrease in funding to support small and medium-sized enterprise users of steel and aluminum;
- $20.0 million decrease for completing the project restoring rail service to Churchill, Manitoba;
- $15.8 million decrease from Budget 2019 reinvestment of receipts from Repayable Contributions
- $5.0 million decrease for concluding the initiative supporting Manitoba’s aerospace sector; and
- $0.5 million net decrease from other minor adjustments.
Total authorities used for the quarter-ended December 31, 2020 decreased to $106.3 million, compared to $113.0 million at December 31, 2019. The $6.7 million decrease, or -6%, is explained by:
- $4.3 million increase in Regional Economic Growth through Innovation payments to deliver the Innovation and Skills Plan;
- $3.8 million increase in payments to provide support to businesses and tourism facing hardship due to COVID-19 through the Regional Recovery and Relief Fund;
- $3.6 million increase for payment timing differences made to network partners;
- $2.1 million increase in payments to deliver a federal strategy on jobs and tourism;
- $2.1 million increase for the Praxis Spinal Cord Institute;
- $1.8 million increase to fund the Canada Coal Transition Initiative;
- $11.5 million decrease in payments for the completion of the project restoring rail service to Churchill, Manitoba
- $8.0 million decrease in payments completing the program to support small and medium-sized enterprise users of steel and aluminum; and
- $4.9 million decrease in payments in Western Diversification Program payments, investing in a diverse and growing economy.
Graph 2 illustrates total authorities available for use for the fiscal year, and authorities used at quarter-end.
(in thousands of dollars)
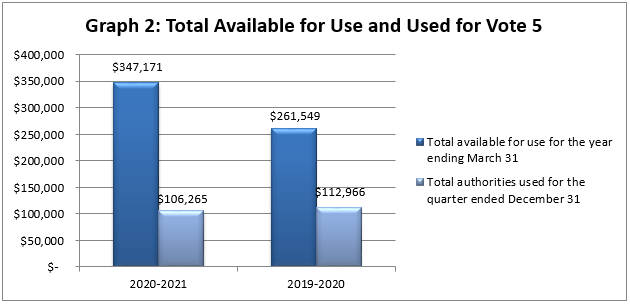
Total Available for Use and Used for Vote 5 (in thousands of dollars)
This bar graph breaks down total authorities available for use for fiscal year 2020-2021 and the authorities used at quarter end and then compares them to fiscal year 2019-2020.
2020-2021
- $347,171 represents total available for use for the year ending March 31
- $106,265 represents year-to-date authorities used for the quarter ending December 31
2019-2020
- $261,549 represents total available for use for the year ending March 31
- $112,966 represents year-to-date authorities used for the quarter ending December 31
Statement of Authorities: Budgetary Statutory Authorities
Budgetary statutory authorities available for use for fiscal year 2020-2021 changed to $511.6 million, an increase of $506.8 million when compared to the $4.8 million in 2019-2020. The increase is a result of additional transfer payments to deliver the Regional Relief and Recovery Fund to support businesses and network partners through the COVID-19 pandemic pursuant to the Public Health Events of National Concern Payments Act.
Total authorities used for the quarter-ended December 31, 2020 increased to $475.8 million, compared to $3.1 million at December 31, 2019. The $472.7 million increase is explained by payments to deliver the Regional Relief and Recovery Fund to support business and network partners through the COVID-19 pandemic.
Graph 3 illustrates total authorities available for use for the fiscal year, and authorities used at quarter-end.
(in thousands of dollars)
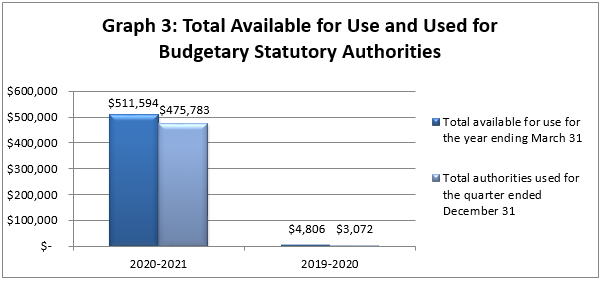
Total Available for Use and Used for Budgetary Statutory Authorities (in thousands of dollars)
This bar graph breaks down total authorities available for use for fiscal year 2020-2021 and the authorities used at quarter end and then compares them to fiscal year 2019-2020.
2020-2021- $511,594 represents total available for use for the year ending March 31
- $475,783 represents year-to-date authorities used for the quarter ending December 31
2019-2020
- $4,806 represents total available for use for the year ending March 31
- $3,072 represents year-to-date authorities used for the quarter ending December 31
Statement of the Departmental Budgetary Expenditures by Standard Object
Expenditures by standard object for the quarter ended December 31, 2020, were $272.9 million, which reflects an increase of $205.7 million, or 306%, from the $67.2 million at December 31, 2019.
The variance is largely due to:
- $215.7 million increase in Regional Relief and Recovery Fund transfer payments, aiming to help western Canadian businesses cope with the financial hardship resulting from COVID-19;
- $1.6 million increase in payments supporting the Canada Coal Transition Initiative;
- $1.3 million increase in Western Diversification Program payments, investing in a diverse and growing economy;
- $1.0 million increase in salary and other personnel costs;
- $0.6 million increase in Regional Economic Growth through Innovation payments to deliver the Innovation and Skills Plan;
- $7.4 million decrease for payments restoring rail service to Churchill, Manitoba;
- $6.5 million decrease in payments supporting small and medium-sized enterprise users of steel and aluminum;
- $0.6 million decrease in operations and maintenance costs as the majority of WD’s workforce has moved to working remotely from home.
Additional information can be found in the Statement of Authorities, Vote 1 and Vote 5 sections above.
Graphs 4 and 5 illustrate actual expenditures for the quarter-end.
(in thousands of dollars)
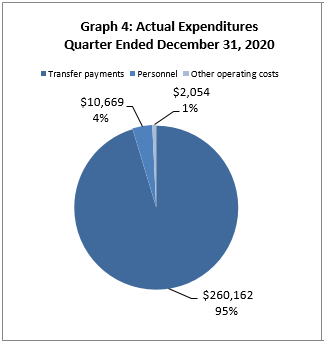
Actual Expenditures Quarter Ended December 31, 2020 (in thousands of dollars)
This pie chart breaks down actual expenditures for the quarter ended December 31, 2020.
- $260,162 represents actual spending on Transfer Payments, which accounts for 95% of Actual Expenditures quarter ended December 31, 2020
- $10,669 represents actual spending on Personnel, which accounts for 4% of Actual Expenditures quarter ended December 31, 2020
- $2,054 represents actual spending on Other operating costs, which accounts for 1% of Actual Expenditures quarter ended December 31, 2020
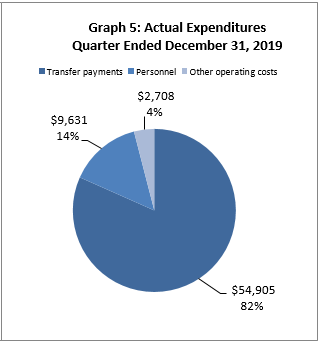
Actual Expenditures Quarter Ended December 31, 2019 (in thousands of dollars)
This pie chart breaks down actual expenditures for quarter ended December 31, 2019.
- $54,905 represents actual spending on Transfer Payments, which accounts for 82% of Actual Expenditures quarter ended December 31, 2019
- $9,631 represents actual spending on Personnel, which accounts for 14% of Actual Expenditures quarter ended December 31, 2019
- $2,708 represents actual spending on Other operating costs, which accounts for 4% of Actual Expenditures quarter ended December 31, 2019
Risks and Uncertainties
The department is managing the allocation of resources within a well-defined framework of accountabilities, policies and procedures including a system of budgets, reporting and other internal controls to manage within available resources and Parliamentary authorities.
WD conducts an annual risk assessment exercise as part of its overall risk management approach. Prior to the COVID-19 pandemic, WD did not identify any significant financial risks from their annual risk assessment.
In response to the COVID-19 pandemic, WD has identified increased enterprise-wide risks including risks to employee physical and mental health, cyber risk, and risks due to the speed of program delivery to get funding to Canadians economically affected by COVID-19 in a timely manner. WD employs risk-based mitigation to reduce risks such as business continuity planning, occupational health and safety planning and people management strategies; a robust system of network systems including encrypted signature, electronic security protocols and mobile equipment to employ remote connectivity; and risk assessments, governance processes, process mapping and segregation of duties when implementing programs.
Significant Changes in Relation to Operations, Personnel and Programs
The COVID-19 pandemic has had significant impacts on businesses, workers and communities across the country and therefore, the Government of Canada created the Regional Relief and Recovery Fund (RRRF) pursuant to the Public Health Events of National Concern Payments Act. During the quarter, there has been an increase in funding for the RRRF.
The Fund will help to:
- mitigate the financial pressure experienced by businesses and organizations to allow them to continue their operations, including paying their employees; and
- support projects by businesses, organizations and communities to prepare now for a successful recovery.
This initiative is implemented by the six Regional Development Agencies, which are familiar with their regions’ economic realities and are often the first point of contact for people at the local level.
The COVID-19 pandemic has required the department to utilize system capabilities allowing WD’s workforce to resume operations remotely and establish on-going communication protocols using tools such as Microsoft Teams.
Approval by Senior Officials
Approved by:
Original signed by:
________________________
Dylan Jones
Deputy Minister
Edmonton, Canada
Date: February 18, 2021
Original signed by:
________________________
Cathy McLean
Chief Financial Officer
Statement of Authorities (unaudited)
Fiscal year 2020-2021 (in thousands of dollars)
| Authorities | Total available for use for the year ending March 31, 2021* | Used during the quarter ended December 31, 2020 | Year-to-date used at quarter-end |
|---|---|---|---|
| Vote 1 - Net operating expenditures | $52,101 | $11,594 | $32,133 |
| Vote 5 - Grants and contributions | 347,171 | 45,677 | 106,265 |
| Budgetary statutory authorities: Employee benefit plans |
5,421 | 1,129 | 3,388 |
| Budgetary statutory authorities: Transfer payments |
506,173 | 214,485 | 472,395 |
| Total authorities | $910,866 | $272,885 | $614,181 |
Fiscal year 2019-2020 (in thousands of dollars)
| Authorities | Total available for use for the year ending March 31, 2020* | Used during the quarter ended December 31, 2019 | Year-to-date used at quarter-end |
|---|---|---|---|
| Vote 1 - Net operating expenditures | $44,518 | $11,315 | $29,642 |
| Vote 5 - Grants and contributions | 261,549 | 54,905 | 112,966 |
| Budgetary statutory authorities: Employee benefit plans |
4,806 | 1,024 | 3,072 |
| Total authorities | $310,873 | $67,244 | $145,680 |
*Includes only Authorities available for use and granted by Parliament at quarter-end.
Departmental Budgetary Expenditures by Standard Object (unaudited)
Fiscal Year 2020-2021 (in thousands of dollars)
| Expenditures | Planned expenditures for the year ending March 31, 2021* | Expended during the quarter ended December 31, 2020 | Year-to-date used at quarter-end |
|---|---|---|---|
| Personnel | $39,955 | $10, 669 | $30,377 |
| Transportation and communications | 3,504 | 14 | 39 |
| Information | 739 | 50 | 163 |
| Professional and special services | 8,949 | 1,570 | 4,117 |
| Rentals | 1,283 | 36 | 238 |
| Repair and maintenance | 1,107 | 1 | 22 |
| Utilities, materials and supplies | 357 | 23 | 36 |
|
Acquisition of machinery and equipment |
1,628 | 429 | 450 |
| Transfer payments | 853,344 | 260,162 | 578,660 |
| Other subsidies and payments | 0 | (69) | 79 |
| Total net budgetary expenditures | $910,866 | $272,885 | $614,181 |
Departmental Budgetary Expenditures by Standard Object (unaudited)
Fiscal Year 2019-2020 (in thousands of dollars)
| Expenditures | Planned expenditures for the year ending March 31, 2020* | Expended during the quarter ended December 31, 2019 | Year-to-date used at quarter-end |
|---|---|---|---|
| Personnel | $35,727 | $9,631 | $26,205 |
| Transportation and communications | 2,815 | 432 | 968 |
| Information | 375 | 103 | 207 |
| Professional and special services | 7,238 | 1,460 | 3,947 |
| Rentals | 1,082 | 148 | 483 |
| Repair and maintenance | 880 | 13 | 34 |
| Utilities, materials and supplies | 172 | 43 | 120 |
|
Acquisition of machinery and equipment |
1,036 | 421 | 505 |
| Transfer payments | 261,548 | 54,905 | 112,966 |
| Other subsidies and payments | 0 | 88 | 245 |
| Total net budgetary expenditures | $310,873 | $67,244 | $145,680 |
*Includes only Authorities available for use and granted by Parliament at quarter-end.
- Date modified: