
Western Economic Diversification Canada’s Quarterly Financial Report for the quarter ended December 31, 2018
View the print-friendly version: PDF
Statement Outlining Results, Risks and Significant Changes in Operations, Personnel and Programs
Introduction
This quarterly financial report should be read in conjunction with the Main Estimates and Supplementary Estimates (A). It has been prepared by management as required by section 65.1 of the Financial Administration Act (FAA) and in the form and manner prescribed by the Treasury Board. This quarterly report has not been subject to an external audit or review.
Authority, Mandate and Program Activities
Western Economic Diversification Canada (WD) is mandated to "promote the development and diversification of the economy of Western Canada and to advance the interests of the West in national economic policy, program and project development and implementation."
The Departmental Plan and Main Estimates and Supplementary Estimates (A) provide further information on WD's authority, mandate and program activities.
Basis of Presentation
This quarterly report has been prepared by management using an expenditure basis of accounting. The accompanying Statement of Authorities includes the department's spending authorities granted by Parliament and those used by the department, consistent with the Main Estimates for the 2018-2019 fiscal year. This quarterly report has been prepared using a special purpose financial reporting framework designed to meet financial information needs with respect to the use of spending authorities.
The authority of Parliament is required before money can be spent by the Government. Approvals are given in the form of annually approved limits through appropriation acts, or through legislation in the form of statutory spending authority for specific purposes.
The Department uses the full accrual method of accounting to prepare and present its annual departmental financial statements that are part of the departmental results reporting process. However, the spending authorities voted by Parliament remain on an expenditure basis.
Financial Structure
WD manages its expenditures under two votes:
- Vote 1 – Net operating expenditures include salary, and other operating costs (e.g., transportation and communications; professional and special services).
- Vote 5 – Grants and contributions include all transfer payments.
Budgetary statutory authorities represent payments made under legislation approved by Parliament, and include items such as the Government of Canada's share of employee benefit plans and other minor items.
Highlights of Fiscal Quarter and Fiscal Year-to-Date (YTD) Results
The following section highlights significant changes to fiscal quarter results as of December 31, 2018.
Statement of Authorities: Vote 1 – Net Operating Expenditures
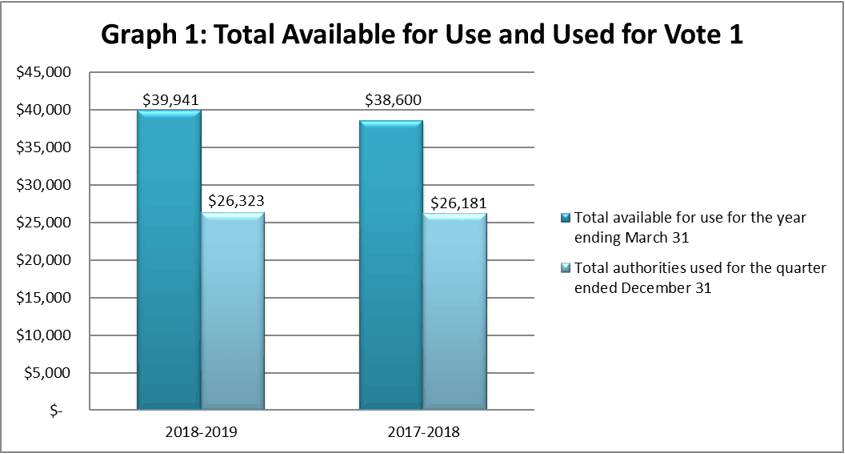
Total authorities available for use for fiscal year 2018-2019 are $39.9 million, a net increase of $1.3 million, or 3%, compared to the $38.6 million for 2017-2018. The net increase is explained by:
- $1.6 million increase to fund Budget 2018 initiatives; and
- $0.3 million decrease for the conclusion of the Drywall Anti-Dumping Relief Program.
Total authorities used year-to-date increased to $26.3 million for the quarter ended December 31, 2018, compared to $26.2 million at December 31, 2017. The $0.1 million increase, or 1%, is mainly explained by an increase in Workplace 2.0 fit-up costs and other operating costs offset by the decrease in lump-sum salary costs to cover retroactive payments from the settlement of various collective bargaining agreements.
Graph 1 illustrates total authorities available for use for the fiscal year, and authorities used at quarter-end.
(in thousands of dollars)
Total Available for Use and Used for Vote 1 (in thousands of dollars)
This bar graph breaks down total authorities available for use for fiscal year 2018-2019 and the authorities used at quarter end and then compares them to fiscal year 2017-2018.
Total Available for Use and Used for Vote 1 (in thousands of dollars)
2018-2019
- $39,941 represents total available for use for the year ending March 31
- $26,323 represents year-to-date authorities used for the quarter ended December 31
2017-2018
- $38,600 represents total available for use for the year ending March 31
- $26,181 represents year-to-date authorities used for the quarter ended December 31
Statement of Authorities: Vote 5 – Grants and Contributions
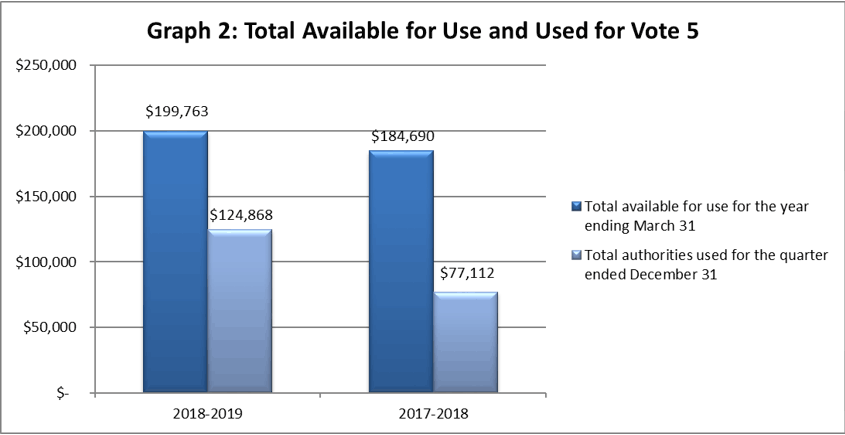
Total authorities available for use for fiscal year 2018-2019 are $199.8 million, a net increase of $15.1 million, or 8%, compared to the $184.7 million for 2017-2018. The net increase is explained by:
- $45.3 million increase to restore rail service to Churchill, Manitoba;
- $29.6 million increase from Budget 2018 to fund the Regional Economic Growth Through Innovation Program;
- $5.0 million increase for new technology and innovation projects in Manitoba's aerospace sector;
- $5.0 million increase from Budget 2017 for the Western Diversification Program;
- $2.4 million net increase for reinvestment of receipts from repayable contributions to increase economic development activities;
- $0.9 million increase from Budget 2018 to fund the Canada Coal Transition Initiative;
- $57.0 million decrease for the conclusion of the Canada 150 Community Infrastructure Program;
- $11.6 million decrease for the conclusion of the Drywall Anti-dumping Duty Relief Program; and
- $4.5 million decrease for the transfer from Agriculture and Agri-Food Canada.
Total authorities used year-to-date for the quarter-ended December 31, 2018 increased to $124.9 million, compared to $77.1 million at December 31, 2017. The $47.8 million increase, or 62%, is explained by:
- $68.3 million increase for payments made to restore rail service to Churchill, Manitoba;
- $6.5 million increase for payments made under the Western Diversification Program;
- $2.1 million increase for payment timing differences made under the Community Futures Program, Women's Enterprise Initiative and Economic Development Initiative;
- $17.0 million decrease for the completion of the Canada 150 Community Infrastructure Program;
- $7.4 million decrease for the completion of the Drywall Anti-Dumping Duty Relief Program; and
- $4.7 million decrease for the conclusion of the project with the Rick Hansen Foundation.
Graph 2 illustrates total authorities available for use for the fiscal year, and authorities used at quarter-end.
(in thousands of dollars)
Total Available for Use and Used for Vote 5 (in thousands of dollars)
This bar graph breaks down total authorities available for use for fiscal year 2018-2019 and the authorities used at quarter end and then compares them to fiscal year 2017-2018.
Total Available for Use and Used for Vote 5 (in thousands of dollars)
2018-2019
- $199,763 represents total available for use for the year ending March 31
- $124,868 represents year-to-date authorities used for the quarter ended December 31
2017-2018
- $184,690 represents total available for use for the year ending March 31
- $77,112 represents year-to-date authorities used for the quarter ended December 31
Statement of Authorities: Budgetary Statutory Authorities
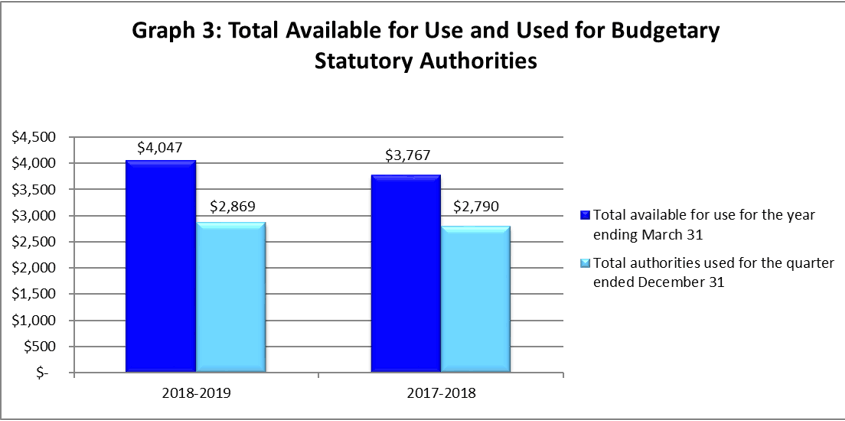
Budgetary statutory authorities available for use for fiscal year 2018-2019 have increased by $0.3 million, or 7%, to $4.0 million explained by additional funding for Budget 2018 initiatives.
Budgetary statutory authorities used for fiscal year 2018-2019 have increased by $0.1 million, or 3%, to $2.9 million explained by payments made to the employee benefit plan reflecting planned requirements.
Graph 3 illustrates total authorities available for use for the fiscal year, and authorities used at quarter-end.
(in thousands of dollars)
Total Available for Use and Used for Budgetary Statutory Authorities (in thousands of dollars)
This bar graph breaks down total authorities available for use for fiscal year 2018-2019 and the authorities used at quarter end and then compares them to fiscal year 2017-2018.
Total Available for Use and Used for Budgetary Statutory Authorities (in thousands of dollars)
2018-2019
- $4,047 represents total available for use for the year ending March 31
- $2,869 represents year-to-date authorities used for the quarter ended December 31
2017-2018
- $3,767 represents total available for use for the year ending March 31
- $2,790 represents year-to-date authorities used for the quarter ended December 31
Statement of the Departmental Budgetary Expenditures by Standard Object
Expenditures by standard object for the quarter ended December 31, 2018, were $42.5 million, a decrease in quarterly payments made of $5.3 million, or 11%, from the $47.8 million at December 31, 2017. This variance is explained by:
- $10.0 million increase for payments made to restore rail service to Churchill, Manitoba;
- $2.0 million increase for payments made under the Western Diversification Program;
- $0.3 million increase for payments made to personnel and other operating and maintenance suppliers;
- $12.4 million decrease for the completion of the Canada 150 Community Infrastructure Program;
- $2.0 million decrease for payment timing differences made under the Community Futures Program, Women's Enterprise Initiative and Economic Development Initiative;
- $1.9 million decrease for the completion of the Drywall Anti-Dumping Duty Relief Program; and
- $1.3 million decrease for the conclusion of the project with the Rick Hansen Foundation.
Additional information can be found in the Statement of Authorities, Vote 1 and Vote 5 sections above.
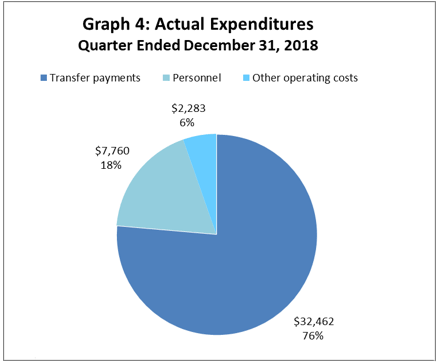
Graphs 4 and 5 illustrate actual expenditures for the quarter-end.
(in thousands of dollars)
Actual Expenditures Quarter Ended December 31, 2018 (in thousands of dollars)
This pie chart breaks down actual expenditures for the quarter ended December 31, 2018.
- $32,462 represents actual spending on Transfer Payments, which accounts for 76% of Actual Expenditures for the quarter ended December 31, 2018
- $7,760 represents actual spending on Personnel, which accounts for 18% of Actual Expenditures for the quarter ended December 31, 2018
- $2,283 represents actual spending on Other operating costs, which accounts for 6% of Actual Expenditures for the quarter ended December 31, 2018
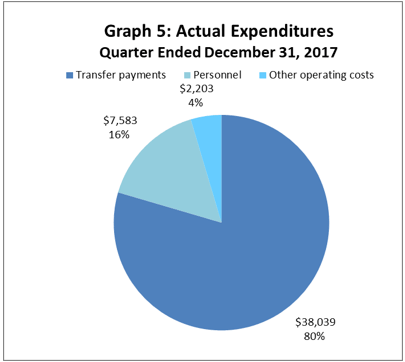
Actual Expenditures Quarter Ended December 31, 2017 (in thousands of dollars)
This pie chart breaks down actual expenditures for quarter ended December 31, 2017.
- $38,039 represents actual spending on Transfer Payments, which accounts for 80% of Actual Expenditures for the quarter ended December 31, 2017
- $7,583 represents actual spending on Personnel, which accounts for 16% of Actual Expenditures for the quarter ended December 31, 2017
- $2,203 represents actual spending on Other operating costs, which accounts for 4% of Actual Expenditures for the quarter ended December 31, 2017
Risks and Uncertainties
The department is managing the allocation of resources within a well-defined framework of accountabilities, policies and procedures including a system of budgets, reporting and other internal controls to manage within available resources and Parliamentary authorities. WD also conducts an annual risk assessment exercise as part of its overall risk management approach. WD has not identified any significant risks from their annual risk assessment.
The department maintains financial management processes to ensure effective budget management. Processes are in place to assess the impact of project timing fluctuations and the process for forecasting multi-year funding requirements. The decision-making process facilitates the re-allocation of financial resources to priority initiatives.
Significant Changes in Relation to Operations, Personnel and Programs
During the 2018-2019 fiscal year, WD has implemented the following programs changes:
Regional Economic Growth through Innovation is a national program delivered by Regional Development Agencies across Canada to fuel economic growth through innovation and create more well-paying jobs for Canadians.
A centrepiece of Budget 2018, the Women Entrepreneurship Strategy is a comprehensive, whole-of-government plan to help women grow their businesses through access to financing, talent, networks and expertise. It highlights the Government of Canada's commitment to create a diverse, inclusive economy that supports prosperity and a better quality of life for all.
The Government of Canada announced support for the acquisition and repair of the Churchill rail line by Arctic Gateway Group, making good on its commitment to restore the Hudson Bay railway line to Churchill and surrounding communities. Through the Western Diversification Program, an investment to the Arctic Gateway Group allows a historic private-public partnership that blends First Nations and community ownership and Canadian private sector leadership, to take over ownership of the Hudson Bay Rail Company, the Hudson Bay Port Company and the Churchill Marine Tank Farm.
Approval by Senior Officials
Approved by:
Original signed by:
________________________
Dylan Jones
Deputy Minister
Edmonton, Canada
Date: February 15, 2019
Original signed by:
________________________
Cathy McLean
Chief Financial Officer
Statement of Authorities (unaudited)
Fiscal year 2018-2019 (in thousands of dollars)
| Authorities | Total available for use for the year ending March 31, 2019* | Used during the quarter ended December 31, 2018 | Year-to-date used at quarter-end |
|---|---|---|---|
| Vote 1 - Net operating expenditures | $ 39,941 | $ 9,087 | $ 26,323 |
| Vote 5 - Grants and contributions | 199,763 | 32,462 | 124,868 |
| Budgetary statutory authorities | 4,035 | 956 | 2,869 |
| Spending of proceeds from the disposal of surplus Crown assets | 12 | - | - |
| Total authorities | $ 243,751 | $ 42,505 | $ 154,060 |
Fiscal year 2017-2018 (in thousands of dollars)
| Authorities | Total available for use for the year ending March 31, 2018* | Used during the quarter ended December 31, 2017 | Year-to-date used at quarter-end |
|---|---|---|---|
| Vote 1 - Net operating expenditures | $ 38,600 | $ 8,846 | $ 26,181 |
| Vote 5 - Grants and contributions | 184,690 | 38,039 | 77,112 |
| Budgetary statutory authorities | 3,751 | 926 | 2,776 |
| Spending of proceeds from the disposal of surplus Crown assets | 16 | 14 | 14 |
| Total authorities | $ 227,057 | $ 47,825 | $ 106,083 |
*Includes only Authorities available for use and granted by Parliament at quarter-end.
Departmental Budgetary Expenditures by Standard Object (unaudited)
Fiscal year 2018-2019 (in thousands of dollars)
| Expenditures | Planned expenditures for the year ending March 31, 2019* | Expended during the quarter ended December 31, 2018 | Year-to-date used at quarter-end |
|---|---|---|---|
| Personnel | $ 30,939 | $ 7,760 | $22,787 |
| Transportation and communications | 1,945 | 444 | 936 |
| Information | 363 | 58 | 119 |
| Professional and special services | 8,175 | 1,530 | 4,073 |
| Rentals | 1,078 | 69 | 334 |
| Repair and maintenance | 519 | 20 | 326 |
| Utilities, materials and supplies | 158 | 39 | 75 |
| Acquisition of machinery and equipment | 811 | 12 | 68 |
| Transfer payments | 199,763 | 32,462 | 124,868 |
| Other subsidies and payments | - | 111 | 474 |
| Total net budgetary expenditures | $ 243,751 | $ 42,505 | $ 154,060 |
Departmental Budgetary Expenditures by Standard Object (unaudited)
Fiscal year 2017-2018 (in thousands of dollars)
| Expenditures | Planned expenditures for the year ending March 31, 2018* | Expended during the quarter ended December 31, 2017 | Year-to-date used at quarter-end |
|---|---|---|---|
| Personnel | $ 29,804 | $ 7,583 | $ 23,968 |
| Transportation and communications | 1,664 | 311 | 681 |
| Information | 426 | 32 | 113 |
| Professional and special services | 7,468 | 1,578 | 3,604 |
| Rentals | 1,206 | 88 | 282 |
| Repair and maintenance | 432 | 13 | 39 |
| Utilities, materials and supplies | 318 | 14 | 48 |
| Acquisition of machinery and equipment | 1,049 | 16 | 58 |
| Transfer payments | 184,690 | 38,039 | 77,112 |
| Other subsidies and payments | - | 151 | 178 |
| Total net budgetary expenditures | $ 227,057 | $ 47,825 | $ 106,083 |
*Includes only Authorities available for use and granted by Parliament at quarter-end.
- Date modified: