
Western Economic Diversification Canada’s Quarterly Financial Report for the quarter ended December 31, 2017
Statement Outlining Results, Risks and Significant Changes in Operations, Personnel and Programs
- Introduction
- Highlights of fiscal quarter and fiscal year to date (YTD) results
- Risks and Uncertainties
- Significant changes in relation to operations, personnel and programs
- Quarterly Financial Report
Introduction
This quarterly financial report should be read in conjunction with the Main Estimates and Supplementary Estimates (A) and Supplementary Estimates (B). It has been prepared by management as required by section 65.1 of the Financial Administration Act (FAA) and in the form and manner prescribed by the Treasury Board. This quarterly report has not been subject to an external audit or review.
Authority, Mandate and Program Activities
Western Economic Diversification Canada (WD) is mandated to "promote the development and diversification of the economy of Western Canada and to advance the interests of the West in national economic policy, program and project development and implementation."
The Departmental Plan and Main Estimates provide further information on WD's authority, mandate and program activities.
Basis of Presentation
This quarterly report has been prepared by management using an expenditure basis of accounting. The accompanying Statement of Authorities includes the department's spending authorities granted by Parliament and those used by the department, consistent with the Main Estimates, Supplementary Estimates (A), and Supplementary Estimates (B) for the 2017-2018 fiscal year. This quarterly report has been prepared using a special purpose financial reporting framework designed to meet financial information needs with respect to the use of spending authorities.
The authority of Parliament is required before money can be spent by the Government. Approvals are given in the form of annually approved limits through appropriation acts, or through legislation in the form of statutory spending authority for specific purposes.
The Department uses the full accrual method of accounting to prepare and present its annual departmental financial statements that are part of the departmental results reporting process. However, the spending authorities voted by Parliament remain on an expenditure basis.
Financial Structure
WD manages its expenditures under two votes:
- Vote 1 – Net operating expenditures include salary, and other operating costs (e.g., transportation and communications; professional and special services).
- Vote 5 – Grants and contributions include all transfer payments.
Budgetary statutory authorities represent payments made under legislation approved by Parliament, and include items such as the Government of Canada's share of employee benefit plans and other minor items.
Highlights of Fiscal Quarter and Fiscal Year to Date (YTD) Results
The following section highlights significant changes to fiscal quarter results as of December 31, 2017.
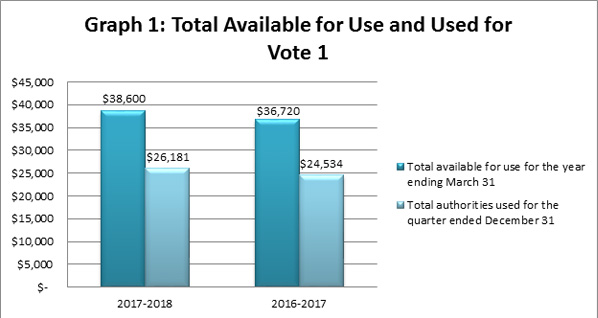
Statement of Authorities: Vote 1 – Net Operating Expenditures
Total authorities available for use for fiscal year 2017-2018 are $38.6 million, a net increase of $1.9 million, or 5%, compared to the $36.7 million for 2016-2017. The net increase is explained by:
- $2.2 million increase to cover retroactive pay for new collective bargaining agreements;
- $0.3 million increase to deliver the Drywall Anti-Dumping Duty Relief Program; and
- $0.6 million net decrease for the delivery of programs on behalf of Infrastructure Canada, for Budget 2016 reductions in professional services, travel and advertising, and other minor adjustments.
Total authorities used year-to-date increased to $26.2 million for the quarter ended December 31, 2017, compared to $24.5 million at December 31, 2016. The increase of $1.7 million, or 7%, is mainly explained by the increase in salary costs to cover retroactive payments from the settlement of various collective bargaining agreements.
Text Version(Link 1): Graph 1 illustrates total authorities available for use for the fiscal year, and authorities used at quarter-end.
(in thousands of dollars)
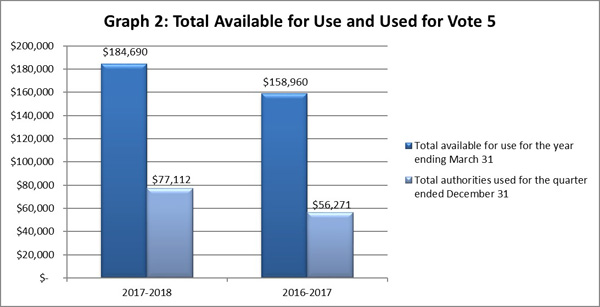
Statement of Authorities: Vote 5 – Grants and Contributions
Total authorities available for use for fiscal year 2017-2018 are $184.7 million, a net increase of $25.7 million, or 16%, compared to the $159.0 million for 2016-2017. The net increase is explained by:
- $11.6 million increase to fund the Drywall Anti-Dumping Duty Relief Program;
- $10.8 million increase to fund the C150 Community Infrastructure Program;
- $4.5 million increase in funding transferred from Agriculture and Agri-Food Canada;
- $0.5 million net decrease for the Rick Hansen Foundation and other minor cash flow adjustments; and
- $0.7 million net decrease to reinvest the receipt of repayable contributions for the Western Diversification Program.
Total authorities used year-to-date for the quarter-ended December 31, 2017 increased to $77.1 million, compared to $56.3 million at December 31, 2016. The $20.8 million increase, or 37%, is mainly explained by reimbursements under the Drywall Anti-Dumping Duty Relief Program, Canada 150 Community Infrastructure Program and timing differences in the processing of claims for reimbursement under various other transfer payment programs.
Text Version(Link 2): Graph 2 illustrates total authorities available for use for the fiscal year, and authorities used at quarter-end.
(in thousands of dollars)
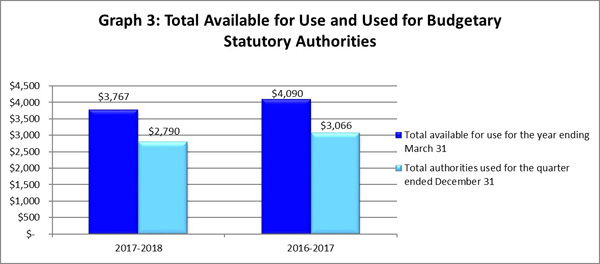
Statement of Authorities: Budgetary Statutory Authorities
Budgetary statutory authorities available for use for fiscal year 2017-2018 have decreased by $0.3 million, or 7%, to $3.8 million compared to 2016-2017. The decrease is due to the regular yearly adjustments to the employee benefit plan to correctly reflect planned requirements.
There are no significant variances in budgetary statutory authorities used for this reporting period when compared to the previous fiscal year.
Text Version(Link 3): Graph 3 illustrates total authorities available for use for the fiscal year, and authorities used at quarter-end.
(in thousands of dollars)
Statement of the Departmental Budgetary Expenditures by Standard Object
Expenditures by standard object for the third quarter ended December 31, 2017, were $47.8 million; an increase of $15.9 million, or 50%, from third quarter expenditures of $31.9 million at December 31, 2016. This variance is due to:
- claims paid under Canada 150 Community Infrastructure Program (increase of $9.2 million);
- claims paid under the Drywall Anti-Dumping Duty Relief Program (increase of $1.9 million);
- timing differences in the processing of claims for reimbursement under various other transfer payment programs (increase of $4.5 million);
- retroactive salary payments and personnel expenditures (increase of $832 thousand); and
- operating savings mainly due to Workplace 2.0 implementation (decrease of $566 thousand).
Additional information can be found in the Statement of Authorities, Vote 1 and Vote 5 sections above.
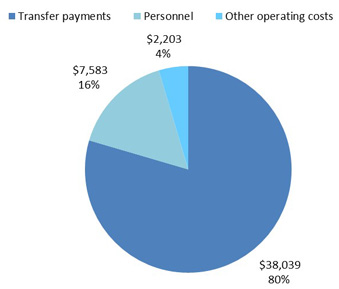
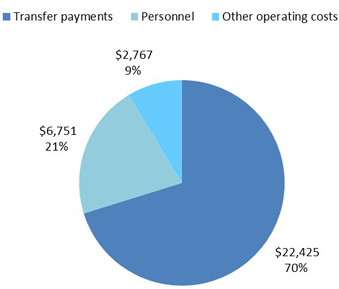
Text Version(Link 4): Graphs 4 and 5 illustrate actual expenditures for the quarter-end.
Graph 4: Actual Expenditures Quarter Ended December 31, 2017
(in thousands of dollars)
Graph 5: Actual Expenditures Quarter Ended December 31, 2016
(in thousands of dollars)
Risks and Uncertainties
The department is managing the allocation of resources for items announced in Budget 2017 within a well-defined framework of accountabilities, policies and procedures including a system of budgets, reporting and other internal controls to manage within available resources and Parliamentary authorities. WD also conducts an annual risk assessment exercise as part of its overall risk management approach. For the 2017-18 risk assessment, no significant financial risks were identified.
The department maintains financial management processes to ensure effective budget management. Processes are in place to assess the impact of project timing fluctuations and the process for forecasting multi-year funding requirements. The decision-making process facilitates the re-allocation of financial resources to priority initiatives.
Significant Changes in Relation to Operations, Personnel and Programs
The Drywall Anti-Dumping Duty Relief Program provides drywall contractors and builders in Western and Northern Canada with compensation for elevated drywall costs due to anti-dumping duties imposed on imported drywall from the United States. Additionally the Program supports homeowners in the Regional Municipality of Wood Buffalo whose homes were severely damaged or destroyed by the 2016 wildfires, and are now facing higher rebuilding costs. This grant program began taking applications on May 1, 2017.
Approval by Senior Officials
Approved by:
Jim Saunderson
A/Deputy Minister
Kathryn Mattern
A/Chief Financial Officer
Edmonton, Canada
Date: January 30, 2018
Statement of Authorities (unaudited)
| Authorities | Fiscal year 2017-2018 (in thousands of dollars) | ||
|---|---|---|---|
| Total available for use for the year ending March 31, 2018* | Used during the quarter ended December 31, 2017 |
Year to date used at quarter-end | |
| Vote 1 - Net operating expenditures | $ 38,600 | $ 8,846 | $ 26,181 |
| Vote 5 – Grants and contributions | 184,690 | 38,039 | 77,112 |
| Budgetary statutory authorities | 3,751 | 926 | 2,776 |
| Spending of proceeds from the disposal of surplus Crown assets | 16 | 14 | 14 |
| Total authorities | $227,057 | $47,825 | $106,083 |
| Authorities | Fiscal year 2016-2017 (in thousands of dollars) | ||
|---|---|---|---|
| Total available for use for the year ending March 31, 2017* | Used during the quarter ended December 31, 2016 |
Year to date used at quarter-end | |
| Vote 1 - Net operating expenditures | $ 36,720 | $ 8,496 | $ 24,534 |
| Vote 5 – Grants and contributions | 158,960 | 22,425 | 56,271 |
| Budgetary statutory authorities | 4,088 | 1,022 | 3,066 |
| Spending of proceeds from the disposal of surplus Crown assets | 2 | - | - |
| Total authorities | $199,770 | $31,943 | $83,871 |
*Includes only Authorities available for use and granted by Parliament at quarter-end.
Departmental Budgetary Expenditures by Standard Object (unaudited)
| Expenditures | Fiscal year 2017-2018 (in thousands of dollars) | ||
|---|---|---|---|
| Planned expenditures for the year ending March 31, 2018* | Expended during the quarter ended December 31, 2017 | Year to date used at quarter-end | |
| Personnel | $ 29,804 | $ 7,583 | $ 23,968 |
| Transportation and communications | 1,664 | 311 | 681 |
| Information | 426 | 32 | 113 |
| Professional and special services | 7,468 | 1,578 | 3,604 |
| Rentals | 1,206 | 88 | 282 |
| Repair and maintenance | 432 | 13 | 39 |
| Utilities, materials and supplies | 318 | 14 | 48 |
| Acquisition of machinery and equipment | 1,049 | 16 | 58 |
| Transfer payments | 184,690 | 38,039 | 77,112 |
| Other subsidies and payments | — | 151 | 178 |
| Total net budgetary expenditures | $227,057 | $47,825 | $106,083 |
| Expenditures | Fiscal year 2016–2017 (in thousands of dollars) | ||
|---|---|---|---|
| Planned expenditures for the year ending March 31, 2017* |
Expended during the quarter ended December 31, 2016 |
Year to date used at quarter-end | |
| Personnel | $ 27,856 | $ 6,751 | $ 21,356 |
| Transportation and communications | 1,398 | 406 | 834 |
| Information | 372 | 29 | 117 |
| Professional and special services | 8,007 | 1,765 | 3,989 |
| Rentals | 1,869 | 133 | 506 |
| Repair and maintenance | 43 | 14 | 184 |
| Utilities, materials and supplies | 263 | 19 | 48 |
| Acquisition of machinery and equipment | 1,002 | 176 | 304 |
| Transfer payments | 158,960 | 22,425 | 56,271 |
| Other subsidies and payments | — | 225 | 262 |
| Total net budgetary expenditures | $199,770 | $31,943 | $83,871 |
*Includes only Authorities available for use and granted by Parliament at quarter-end.
- Date modified: