
Western Economic Diversification Canada's Quarterly Financial Report for the quarter ended December 31, 2015
Statement outlining results, risks and significant changes in operations, personnel and program
- Introduction
- Highlights of fiscal quarter and fiscal year to date (YTD) results
- Risks and Uncertainties
- Significant changes in relation to operations, personnel and programs
- Quarterly Financial Report
Introduction
This quarterly financial report should be read in conjunction with the Main Estimates and the Quarterly Financial Report for the quarters ended June 30 and September 30, 2015. It has been prepared by management as required by section 65.1 of the Financial Administration Act and in the form and manner prescribed by the Treasury Board. This quarterly report has not been subject to an external audit or review.
Authority, Mandate and Program Activities
Western Economic Diversification Canada (WD) is mandated to "promote the development and diversification of the economy of Western Canada and to advance the interests of the West in national economic policy, program and project development and implementation."
The Report on Plans and Priorities and Main Estimates provide further information on WD's authority, mandate and program activities.
Basis of Presentation
This quarterly report has been prepared by management using an expenditure basis of accounting. The accompanying Statement of Authorities includes the department's spending authorities granted by Parliament and those used by the department, consistent with the Main Estimates for fiscal year 2015–16. This quarterly report has been prepared using a special purpose financial reporting framework designed to meet financial information needs with respect to the use of spending authorities.
The authority of Parliament is required before moneys can be spent by the Government. Approvals are given in the form of annually approved limits through appropriation acts or through legislation in the form of statutory spending authority for specific purposes.
The department uses the full accrual method of accounting to prepare and present its annual financial statements that are part of the departmental performance reporting process. However, the spending authorities voted by Parliament remain on an expenditure basis.
Highlights of fiscal quarter and fiscal year to date (YTD) results
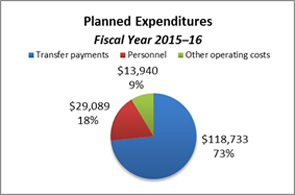
Total Authorities Available for Use and Planned Expenditures for the Year Ending March 31, 2016
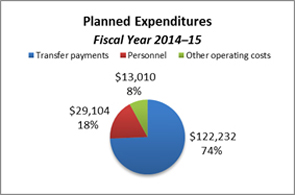
Planned departmental spending is concentrated in transfer payments (73 percent) and personnel (18 percent). Combined, they account for 91 percent of total planned expenditures (refer to the fiscal year 2015-16 pie chart below). This planned spending pattern remains consistent when compared to fiscal year 2014-15 and it is expected to continue for the remainder of fiscal year 2015-16.
The department experienced an overall decrease in total funding available for use and planned expenditures to $161.8 million for fiscal year 2015-16, compared to $164.4 million for fiscal year 2014–15, as illustrated in the "Statement of Authorities" and "Departmental Budgetary Expenditures by Standard Object" tables. The net decrease of $2.6 million (2 percent) is due to:
- A decrease in funding, due to timing, related to the reinvestment of receipts from repayable contributions ($2.4 million);
- A decrease related to the transfer of contribution funding to support the establishment of the Canadian Beef Centre of Excellence from Agriculture and Agri-Food Canada, and a minor reduction to the Rick Hansen Foundation ($1.1 million);
- A net increase of $914 thousand in other funding, notably related to Workplace 2.0 fit-up and Operating Budget Carry Forward.
Text Version (Link 1): Pie Chart: Planned Expenditures for Fiscal Year 2015—2016
(in thousands of dollars)
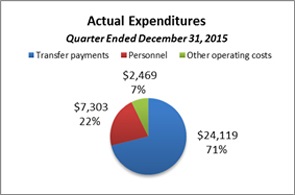
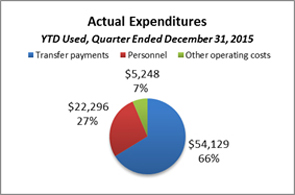
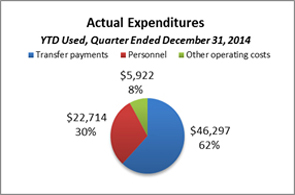
Total Authorities Used and Expended for the Quarter Ended December 31, 2015 and YTD Used at Quarter-End
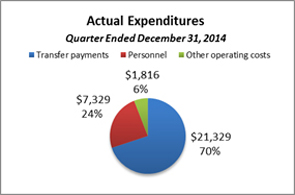
Total authorities used for the third quarter and year to date are concentrated in transfer payments (66 percent) and personnel (27 percent). Combined, they account for over 93 percent of third quarter and year to date actual expenditures (refer to the fiscal year 2015–16 pie charts below). This spending pattern remains consistent when compared to the same period of fiscal year 2014–15, and it is expected to continue for the remainder of fiscal year 2015–16 as explained below.
Third quarter and year to date spending reflect an overall increase of $3.4 million (11 percent) and $6.7 million (9 percent) respectively, in total authorities used and actual expenditures for fiscal year 2015–16 when compared to fiscal year 2014–15, as illustrated in the "Statement of Authorities" and "Departmental Budgetary Expenditures by Standard Object" tables. The increase is due to:
- an increase of $2.8 million quarterly and $7.8 million year to date due to timing differences in the processing of claims for reimbursement of various transfer payment programs;
- Changes in operating costs, notably the decrease due to a one-time transition payment for implementing salary payments in arrears by the Government of Canada and an increase in Workplace 2.0 expenditures. As a result, there is an increase of $627 thousand quarterly and a decrease of $1.1 million year to date.
Text Version (Link 2): Pie Chart: Actual Expenditures for Fiscal Year 2015—2016
(in thousands of dollars)
Risks and Uncertainties
The department is managing the reallocation of existing resources for items announced in Budget 2015 within a well-defined framework of accountabilities, policies and procedures including a system of budgets, reporting and other internal controls to manage within available resources and Parliamentary authorities. WD conducts an annual risk assessment process to update its corporate risk profile. The key corporate risks identified for 2015-16 do not have a direct impact on financial reporting.
The department maintains its financial management processes and it will continue to strengthen them, such that budget management remains effective. this includes assessing the impact of project timing fluctuations and the process for forecasting multi-year funding requirements. The decision-making process facilitates the re-allocation of financial resources to higher priority initiatives.
Significant changes in relation to operations, personnel and programs
On November 4, 2015, the Honourable Navdeep Singh Bains was appointed the Minister responsible for Western Economic Diversification.
Approval by Senior Officials
Approved by:
Daphne Meredith
Deputy Minister
Kathryn Mattern
Acting Chief Financial Officer
Edmonton, Canada
Date: February 18, 2016
Statement of Authorities (unaudited)
| (in thousands of dollars) | Fiscal year 2015–16 | ||
|---|---|---|---|
| Total available for use for the year ending March 31, 2016* | Used during the quarter ended December 31, 2015 | Year to date used at quarter-end | |
| Vote 1 – Operating expenditures | 38,841 | 8,725 | 24,404 |
| Vote 5 – Grants and contributions | 118,733 | 24,119 | 54,129 |
| Budgetary statutory authorities | |||
| Contributions to employee benefit plans | 4,184 | 1,046 | 3,138 |
| Minister's salary and motor car allowance | 2 | 1 | 2 |
| Spending of proceeds from the disposal of surplus Crown assets | 2 | — | — |
| Total budgetary authorities | 161,762 | 33,891 | 81,673 |
| (in thousands of dollars) | Fiscal year 2014–15 | ||
|---|---|---|---|
| Total available for use for the year ending March 31, 2015* |
Used during the quarter ended December 31, 2014 | Year to date used at quarter-end | |
| Vote 1 – Operating expenditures | 37,998 | 8,116 | 25,545 |
| Vote 5 – Grants and contributions | 122,232 | 21,329 | 46,297 |
| Budgetary statutory authorities | |||
| Contributions to employee benefit plans | 4,114 | 1,028 | 3,085 |
| Collection agency fees under section 17.1 of the Financial Administration Act | — | — | 4 |
| Minister's salary and motor car allowance | 2 | 1 | 2 |
| Total budgetary authorities | 164,346 | 30,474 | 74,933 |
More information is available in the following table.
* Includes only authorities available for use and granted by Parliament at quarter end.
Departmental Budgetary Expenditures by Standard Object (unaudited)
| (in thousands of dollars) | Fiscal year 2015–16 | ||
|---|---|---|---|
| Planned expenditures for the year ending March 31, 2016 | Expended during the quarter ended December 31, 2015 | Year to date used at quarter-end | |
| Expenditures | |||
| Personnel | 29,089 | 7,303 | 22,296 |
| Transportation and communications | 1,507 | 195 | 577 |
| Information | 439 | 22 | 173 |
| Professional and special services | 9,145 | 1,371 | 3,655 |
| Rentals | 1,857 | 211 | 652 |
| Repair and maintenance | 35 | 3 | 4 |
| Utilities, materials and supplies | 259 | 15 | 43 |
| Acquisition of machinery and equipment | 698 | 30 | 59 |
| Transfer payments | 118,733 | 24,119 | 54,129 |
| Other subsidies and payments | — | 622 | 85 |
| Total budgetary expenditures | 161,762 | 33,891 | 81,673 |
| (in thousands of dollars) | Fiscal year 2014–15 | ||
|---|---|---|---|
| Planned expenditures for the year ending March 31, 2015 | Expended during the quarter ended December 31, 2014 | Year to date used at quarter-end | |
| Expenditures | |||
| Personnel | 29,104 | 7,329 | 22,714 |
| Transportation and communications | 1,388 | 242 | 678 |
| Information | 430 | 22 | 119 |
| Professional and special services | 7,605 | 1,089 | 3,207 |
| Rentals | 2,296 | 233 | 565 |
| Repair and maintenance | 143 | 8 | 13 |
| Utilities, materials and supplies | 574 | 33 | 61 |
| Acquisition of machinery and equipment | 574 | 20 | 38 |
| Transfer payments | 122,232 | 21,329 | 46,297 |
| Other subsidies and payments | — | 169 | 1,241 |
| Total budgetary expenditures | 164,346 | 30,474 | 74,933 |
- Date modified: