
Western Economic Diversification Canada’s Quarterly Financial Report for the quarter ended December 31, 2014
Statement outlining results, risks and significant changes in operations, personnel and program
- Introduction
- Highlights of fiscal quarter and fiscal year to date (YTD) results
- Risks and Uncertainties
- Significant changes in relation to operations, personnel and programs
- Budget 2012 Implementation
- Quarterly Financial Report
Introduction
This quarterly financial report should be read in conjunction with the Main Estimates, Supplementary Estimates (B) and the Quarterly Financial Report for the quarters ended June 30 and September 30, 2014. It has been prepared by management as required by section 65.1 of the Financial Administration Act and in the form and manner prescribed by the Treasury Board. This quarterly report has not been subject to an external audit or review.
Authority, Mandate and Program Activities
Western Economic Diversification Canada (WD) is mandated to “promote the development and diversification of the economy of Western Canada and to advance the interests of the West in national economic policy, program and project development and implementation.”
The Report on Plans and Priorities and Main Estimates provide further information on WD’s authority, mandate and program activities.
Basis of Presentation
This quarterly report has been prepared by management using an expenditure basis of accounting. The accompanying Statement of Authorities includes the department’s spending authorities granted by Parliament and those used by the department, consistent with the Main Estimates and Supplementary Estimates (B) for fiscal year 2014–15. This quarterly report has been prepared using a special purpose financial reporting framework designed to meet financial information needs with respect to the use of spending authorities.
The authority of Parliament is required before moneys can be spent by the Government. Approvals are given in the form of annually approved limits through appropriation acts or through legislation in the form of statutory spending authority for specific purposes.
The department uses the full accrual method of accounting to prepare and present its annual departmental financial statements that are part of the departmental performance reporting process. However, the spending authorities voted by Parliament remain on an expenditure basis.
Highlights of fiscal quarter and fiscal year to date (YTD) results
Total Authorities Available for Use and Planned Expenditures for the Year Ending March 31, 2015
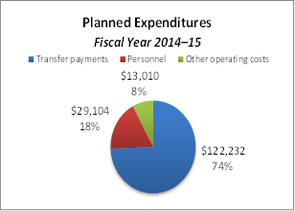
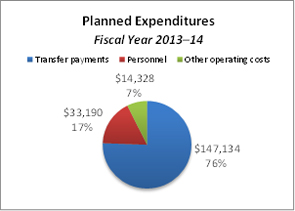
Planned departmental spending is concentrated in transfer payments (74 percent) and personnel (18 percent). Combined, they account for 92 percent of total planned expenditures (refer to the fiscal year 2014–15 pie chart below). This planned spending pattern remains consistent when compared to fiscal year 2013–14 and it is expected to continue for the remainder of fiscal year 2014–15.
The department experienced an overall decrease in total funding available for use and planned expenditures to $164.4 million for fiscal year 2014–15, compared to $194.7 million for fiscal year 2013–14, as illustrated in the "Statement of Authorities" and "Departmental Budgetary Expenditures by Standard Object" tables. The net decrease of $30.3 million (16 percent) is due to:
- a decrease in funding related to the wind down of the Community Infrastructure Investment Fund ($27.4 million);
- a decrease realized through the savings measures announced in Budget 2012 ($7 million);
- an increase related to the transfer of contribution funding from Agriculture and Agri-Food Canada to support the establishment of the Canadian Beef Centre of Excellence ($2 million);
- a net increase in funding to support the Rick Hansen Foundation ($1.5 million);
- a decrease for reductions related to new direction for Regional Federal Councils, and other reductions to address workspace redesign in fiscal year 2015-16 ($1.1 million);
- an increase for the reinvestment of receipts from repayable contributions ($956 thousand);
- a net increase in other funding, notably related to the Economic Development Initiative ($753 thousand).
Text Version (Link 1): Pie Chart: Planned Expenditures for Fiscal Year 2014—2015
(in thousands of dollars)
Total Authorities Used and Expended for the Quarter Ended December 31, 2014 and YTD Used at Quarter-End
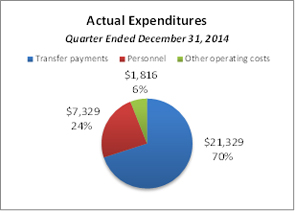
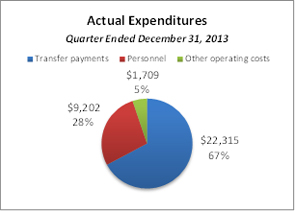
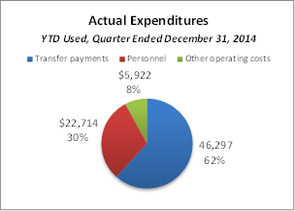
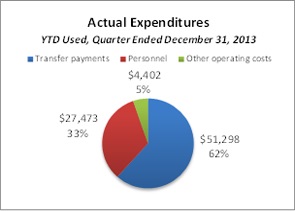
Total authorities used for the third quarter and year to date is concentrated in transfer payments and personnel. Combined, they account for over 90 percent of third quarter and year to date actual expenditures (refer to the fiscal year 2014–15 pie charts below). This spending pattern has changed slightly when compared to the same period of fiscal year 2013–14, and it is expected to continue for the remainder of fiscal year 2014–15 as explained below.
Third quarter and year to date spending both reflect an overall decrease of $2.7 million (8 percent) and $8.2 million (10 percent), respectively, in total authorities used and actual expenditures for fiscal year 2014–15 when compared to fiscal year 2013–14, as illustrated in the “Statement of Authorities” and “Departmental Budgetary Expenditures by Standard Object” tables. The net decrease is due to:
- the completion of the Community Infrastructure Improvement Fund (decrease of $5.2 million quarterly and $8.1 million year to date);
- a decrease in personnel costs due to staff savings (quarterly and year to date decrease of $1.8 million and $4.7 million, respectively);
- various net changes in other operating costs and transfer payments when compared to third quarter of 2013–14 (net increase of $3.8 million quarterly and $2.1 million year to date);
- an increase in spending to support the Rick Hansen Foundation ($516 thousand quarterly; $1.5 million year to date)
- an increase due to a one-time transition payment in other operating costs for implementing salary payment in arrears by the Government of Canada ($10 thousand quarterly; $962 thousand year to date).
Text Version (Link 2): Pie Chart: Actual Expenditures for Fiscal Year 2014—2015
(in thousands of dollars)
Risks and Uncertainties
The department is managing the implementation of cost containment measures and strategic review savings within a well-defined framework of accountabilities, policies and procedures. It has the necessary system of budgets, reporting and other internal controls to manage within available resources and Parliamentary authorities. Proportionally reduced budget allocations to business and internal services units, supported by the regular review of staffing, and actual and forecast expenditure reports ensure resource utilization remains in line with financial and human resources planning, such that adjustments can be made on time.
The department maintains its financial management processes and it will continue to strengthen them, such that budget management remains effective. this includes assessing the impact of project timing fluctuations and the process for forecasting multi-year funding requirements. The decision-making process facilitates the re-allocation of financial resources to higher-priority initiatives.
Significant changes in relation to operations, personnel and programs
The only significant changes in relation to operations, personnel and programs for this reporting period relate to Budget 2012, as explained in the "Budget 2012 Implementation" section.
Budget 2012 Implementation
This section provides an overview of the savings measures announced in Budget 2012 that are being implemented in order to refocus government and programs; make it easier for Canadians and businesses to deal with their government; and, modernize and reduce the back office.
The department will achieve cumulative savings of $16.3 million by fiscal year-end 2014–15 through efficiency measures and scaling back where the need is reduced; transforming how it works internally; and by consolidating and streamlining. The department had undertaken a review of internal services that has consolidated functions, notably procurement and accounting operations, to eliminate duplication and reduce operating costs. Other savings measures include: the transfer of the internal audit function to the Office of the Comptroller General; the adoption of a life cycle approach to the management of transfer payment projects; and various other managed expenditure reductions such as travel, professional services and transfer payments. With these changes, WD will focus on supporting management excellence and accountability across government.
In the first year of implementation, fiscal year 2012–13, WD achieved savings of $6.6 million. Savings increased to $9.3 million in 2013–14 and will result in ongoing, cumulative savings of $16.3 million in 2014–15.
The department has realized net savings in actual expenditures of $1.9 million for the third quarter and $3.8 million year to date of 2014–15. The balance of Budget 2012 savings will continue to be reflected through to fiscal year-end.
The department will continue to manage financial risks and uncertainties related to the anticipated costs of implementing personnel reduction measures in order to achieve the savings outlined in Budget 2012, the costs of which will vary depending on the timing of employee departures. WD continues to mitigate the implementation of Budget 2012 initiatives through financial management and monitoring processes that facilitate the re-allocation of resources, and financial and human resources planning.
There were no significant changes in relation to operations, personnel and programs for this reporting period related to Budget 2012 initiatives.
Approval by Senior Officials
Approved by:
Deputy Minister
Acting Chief Financial Officer
Edmonton, Canada
Date: February 16, 2015
Statement of Authorities (unaudited)
| (in thousands of dollars) | Fiscal year 2014–15 | ||
|---|---|---|---|
| Total available for use for the year ending March 31, 2015* |
Used during the quarter ended December 31, 2014 | Year to date used at quarter-end | |
| Vote 1 – Operating expenditures | 37,998 | 8,116 | 25,545 |
| Vote 5 – Grants and contributions | 122,232 | 21,329 | 46,297 |
| Budgetary statutory authorities | |||
| Contributions to employee benefit plans | 4,114 | 1,028 | 3,085 |
| Collection agency fees under section 17.1 of the Financial Administration Act | — | — | 4 |
| Minister’s salary and motor car allowance | 2 | 1 | 2 |
| Total budgetary authorities | 164,346 | 30,474 | 74,933 |
| (in thousands of dollars) | Fiscal year 2013–14 | ||
|---|---|---|---|
| Total available for use for the year ending March 31, 2014* | Used during the quarter ended December 31, 2013 | Year to date used at quarter-end | |
| Vote 1 – Operating expenditures | 42,626 | 9,687 | 28,206 |
| Vote 5 – Grants and contributions | 147,134 | 22,315 | 51,298 |
| Budgetary statutory authorities | |||
| Contributions to employee benefit plans | 4,889 | 1,223 | 3,667 |
| Minister's salary and motor car allowance | 2 | 1 | 2 |
| Spending of proceeds from the disposal of surplus Crown assets | 1 | — | — |
| Total budgetary authorities | 194,652 | 33,226 | 83,173 |
More information is available in the following table.
* Includes only authorities available for use and granted by Parliament at quarter end.
Departmental Budgetary Expenditures by Standard Object (unaudited)
| (in thousands of dollars) | Fiscal year 2014–15 | ||
|---|---|---|---|
| Planned expenditures for the year ending March 31, 2015 | Expended during the quarter ended December 31, 2014 | Year to date used at quarter-end | |
| Expenditures | |||
| Personnel | 29,104 | 7,329 | 22,714 |
| Transportation and communications | 1,388 | 242 | 678 |
| Information | 430 | 22 | 119 |
| Professional and special services | 7,605 | 1,089 | 3,207 |
| Rentals | 2,296 | 233 | 565 |
| Repair and maintenance | 143 | 8 | 13 |
| Utilities, materials and supplies | 574 | 33 | 61 |
| Acquisition of machinery and equipment | 574 | 20 | 38 |
| Transfer payments | 122,232 | 21,329 | 46,297 |
| Other subsidies and payments | — | 169 | 1,241 |
| Total budgetary expenditures | 164,346 | 30,474 | 74,933 |
| (in thousands of dollars) | Fiscal year 2013–14 | ||
|---|---|---|---|
| Planned expenditures for the year ending March 31, 2014 | Expended during the quarter ended December 31, 2013 | Year to date used at quarter-end | |
| Expenditures | |||
| Personnel | 33,190 | 9,202 | 27,473 |
| Transportation and communications | 3,254 | 416 | 808 |
| Information | 406 | 65 | 210 |
| Professional and special services | 7,839 | 985 | 2,331 |
| Rentals | 1,614 | 232 | 669 |
| Repair and maintenance | 108 | 3 | 9 |
| Utilities, materials and supplies | 534 | 31 | 92 |
| Acquisition of machinery and equipment | 573 | 67 | 152 |
| Transfer payments | 147,134 | 22,315 | 51,298 |
| Other subsidies and payments | — | (90) | 131 |
| Total budgetary expenditures | 194,652 | 33,226 | 83,173 |
- Date modified: